
ES Daily Plan | May 9, 2025
Key Levels & Market Context for the Upcoming Session.

For new followers: The yellow levels highlighted at the bottom left of the chart are the primary levels that I focus on intraday. My strategy for preventing impulsive decisions at unfavorable locations involves following a simple yet effective rule of exercising caution when initiating trades outside of the yellow levels. This implies that I am cautious chasing longs above the final yellow upside target and shorts below the final yellow downside target. It is crucial to understand that refraining from chasing a trade is not an automatic invitation to initiate a trade in the opposite direction.
Make sure to review the Weekly Plan, which provides a broader perspective and highlights key levels of interest to observe in the upcoming week.

Visual Representation
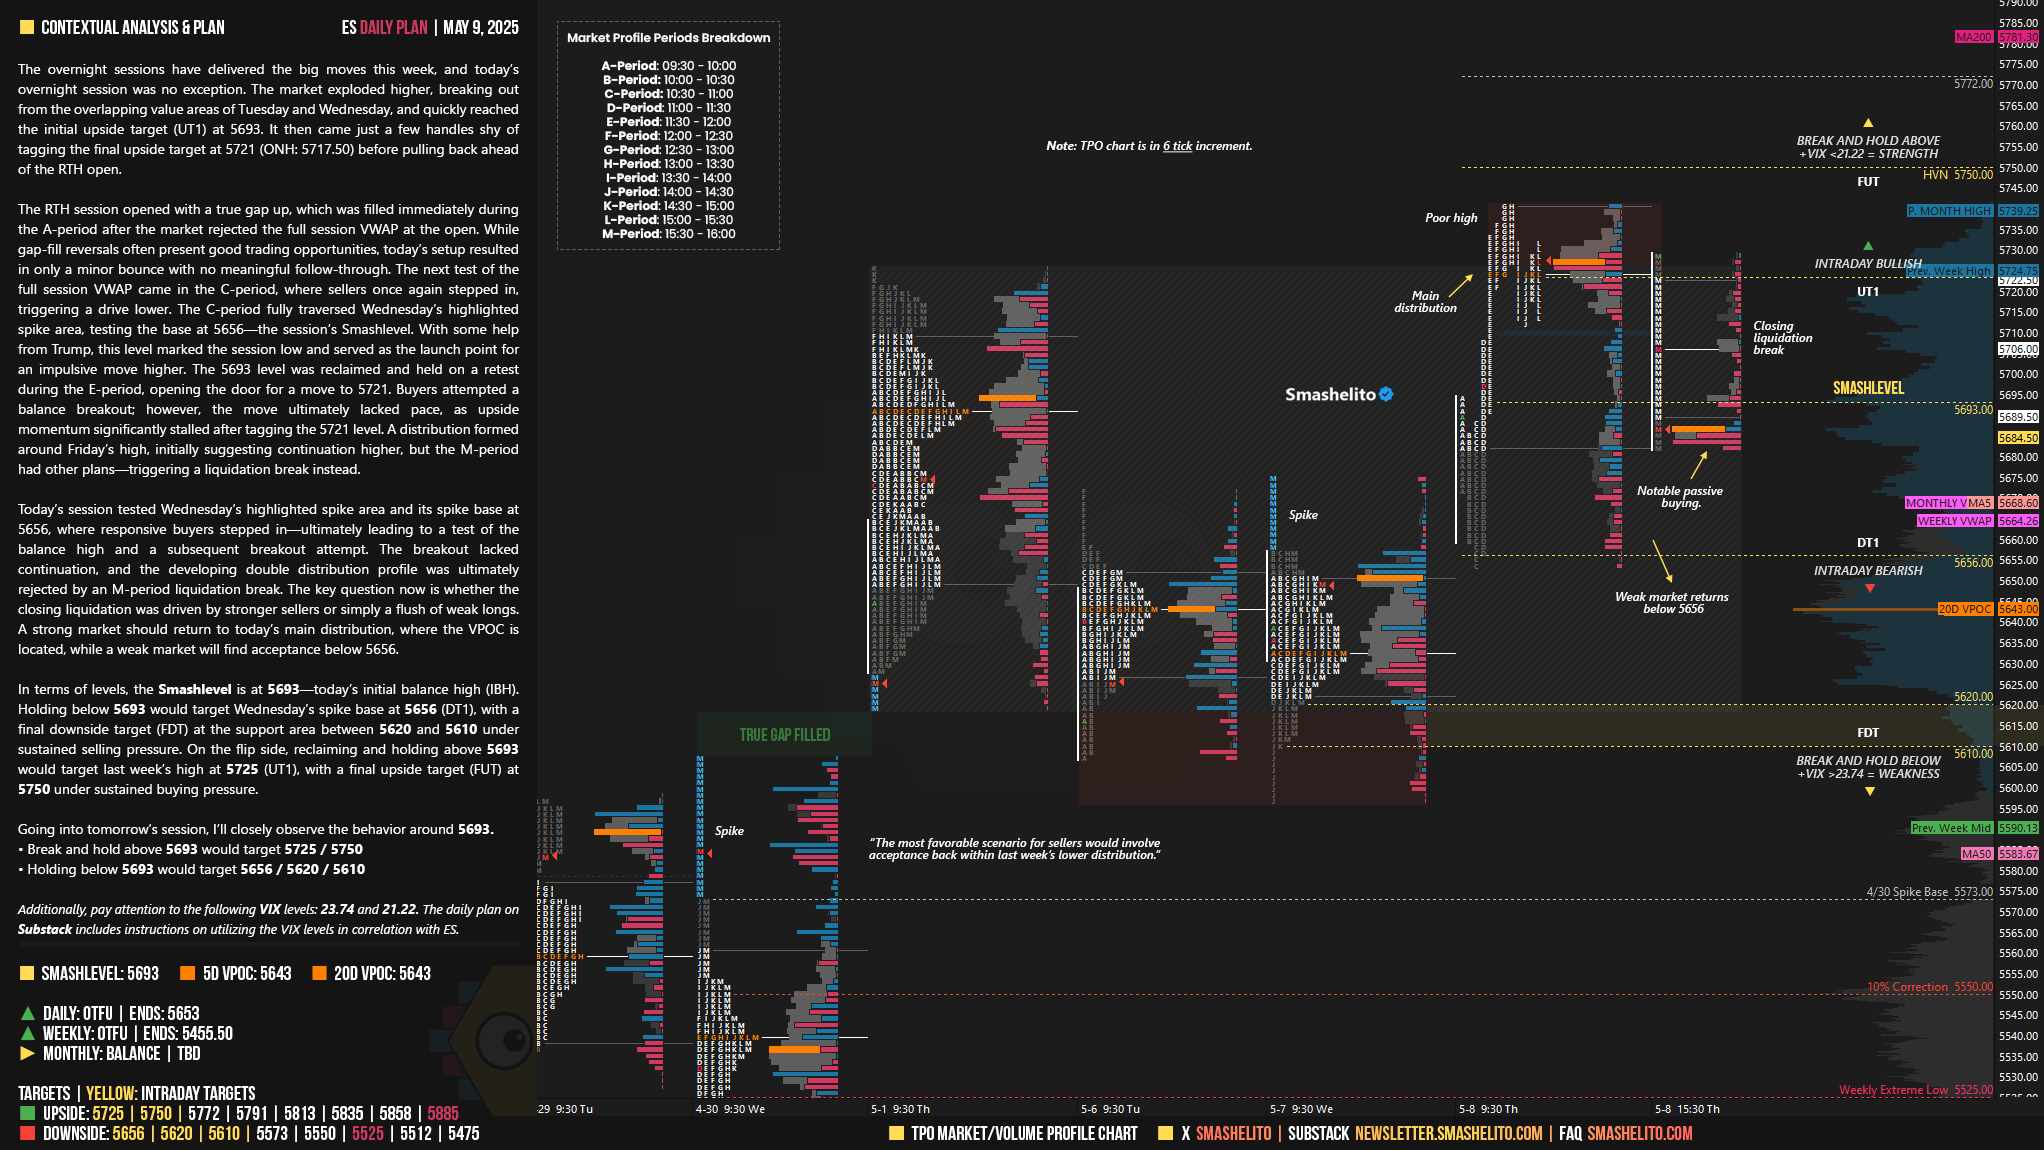
Contextual Analysis & Plan
The overnight sessions have delivered the big moves this week, and today’s overnight session was no exception. The market exploded higher, breaking out from the overlapping value areas of Tuesday and Wednesday, and quickly reached the initial upside target (UT1) at 5693. It then came just a few handles shy of tagging the final upside target at 5721 (ONH: 5717.50) before pulling back ahead of the RTH open.
The RTH session opened with a true gap up, which was filled immediately during the A-period after the market rejected the full session VWAP at the open. While gap-fill reversals often present good trading opportunities, today’s setup resulted in only a minor bounce with no meaningful follow-through. The next test of the full session VWAP came in the C-period, where sellers once again stepped in, triggering a drive lower. The C-period fully traversed Wednesday’s highlighted spike area, testing the base at 5656—the session’s Smashlevel. With some help from Trump, this level marked the session low and served as the launch point for an impulsive move higher. The 5693 level was reclaimed and held on a retest during the E-period, opening the door for a move to 5721. Buyers attempted a balance breakout; however, the move ultimately lacked pace, as upside momentum significantly stalled after tagging the 5721 level. A distribution formed around Friday’s high, initially suggesting continuation higher, but the M-period had other plans—triggering a liquidation break instead.
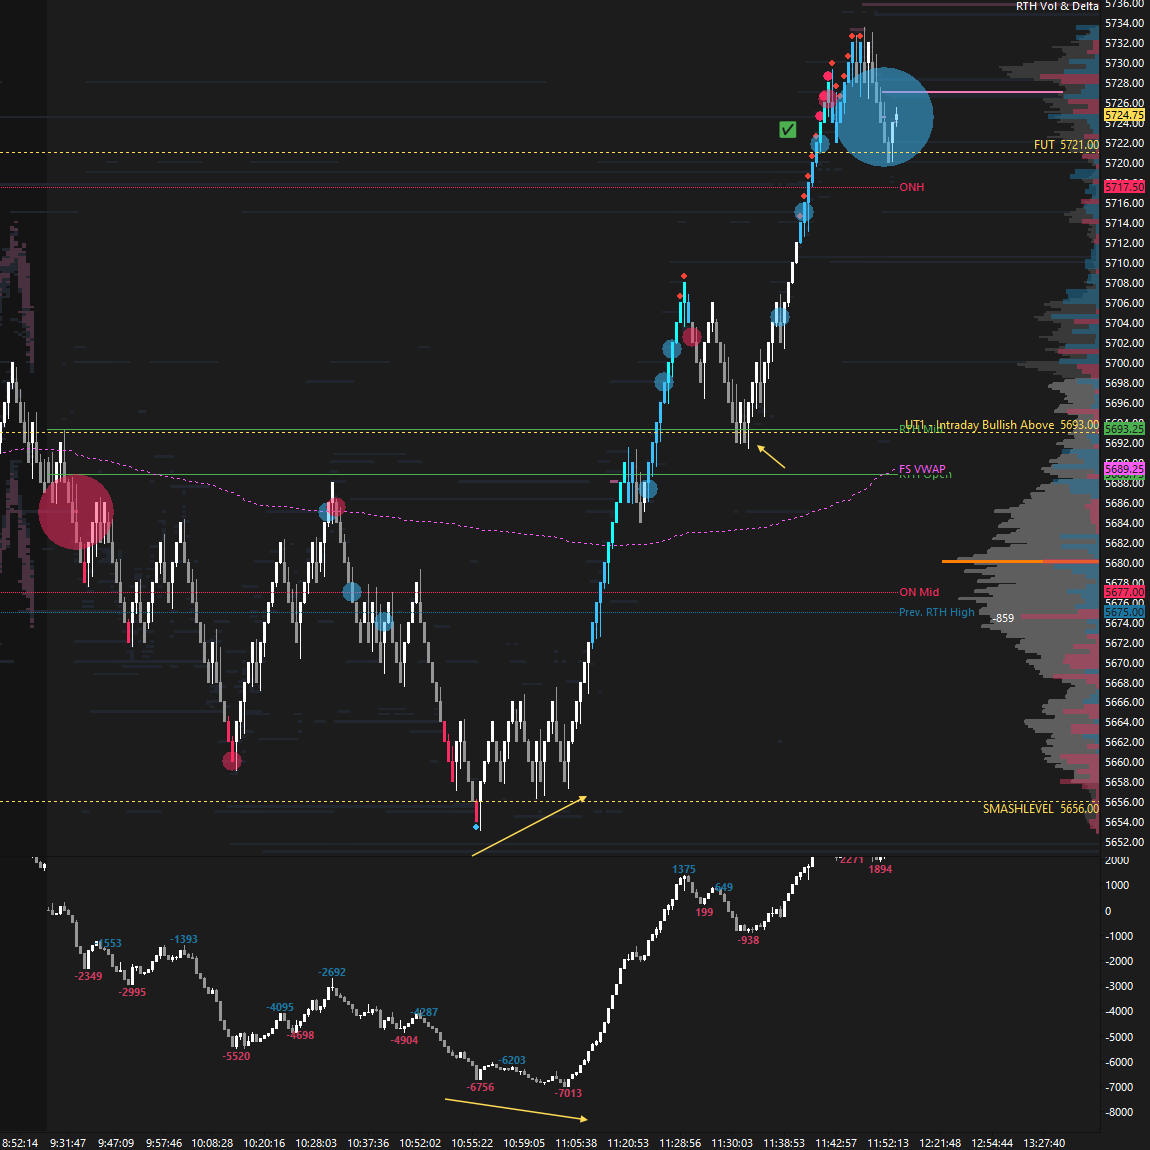
Today’s session tested Wednesday’s highlighted spike area and its spike base at 5656, where responsive buyers stepped in—ultimately leading to a test of the balance high and a subsequent breakout attempt. The breakout lacked continuation, and the developing double distribution profile was ultimately rejected by an M-period liquidation break. The key question now is whether the closing liquidation was driven by stronger sellers or simply a flush of weak longs. A strong market should return to today’s main distribution, where the VPOC is located, while a weak market will find acceptance below 5656.
In terms of levels, the Smashlevel is at 5693—today’s initial balance high (IBH). Holding below 5693 would target Wednesday’s spike base at 5656 (DT1), with a final downside target (FDT) at the support area between 5620 and 5610 under sustained selling pressure. On the flip side, reclaiming and holding above 5693 would target last week’s high at 5725 (UT1), with a final upside target (FUT) at 5750 under sustained buying pressure.
Levels of Interest
Going into tomorrow’s session, I’ll closely observe the behavior around 5693.
Break and hold above 5693 would target 5725 / 5750
Holding below 5693 would target 5656 / 5620 / 5610
Additionally, pay attention to the following VIX levels: 23.74 and 21.22. These levels can provide confirmation of strength or weakness.
Break and hold above 5750 with VIX below 21.22 would confirm strength.
Break and hold below 5610 with VIX above 23.74 would confirm weakness.
Overall, it's important to exercise caution when trading outside of the highlighted yellow levels. A non-cooperative VIX may suggest possible reversals i.e trade setups.
Thank you as always, 5656 paid!
What a good ON and RTH session for me…..thanks Smash as always