
ES Daily Plan | May 4, 2026
Market Context & Key Levels for the Day Ahead

— For new subscribers
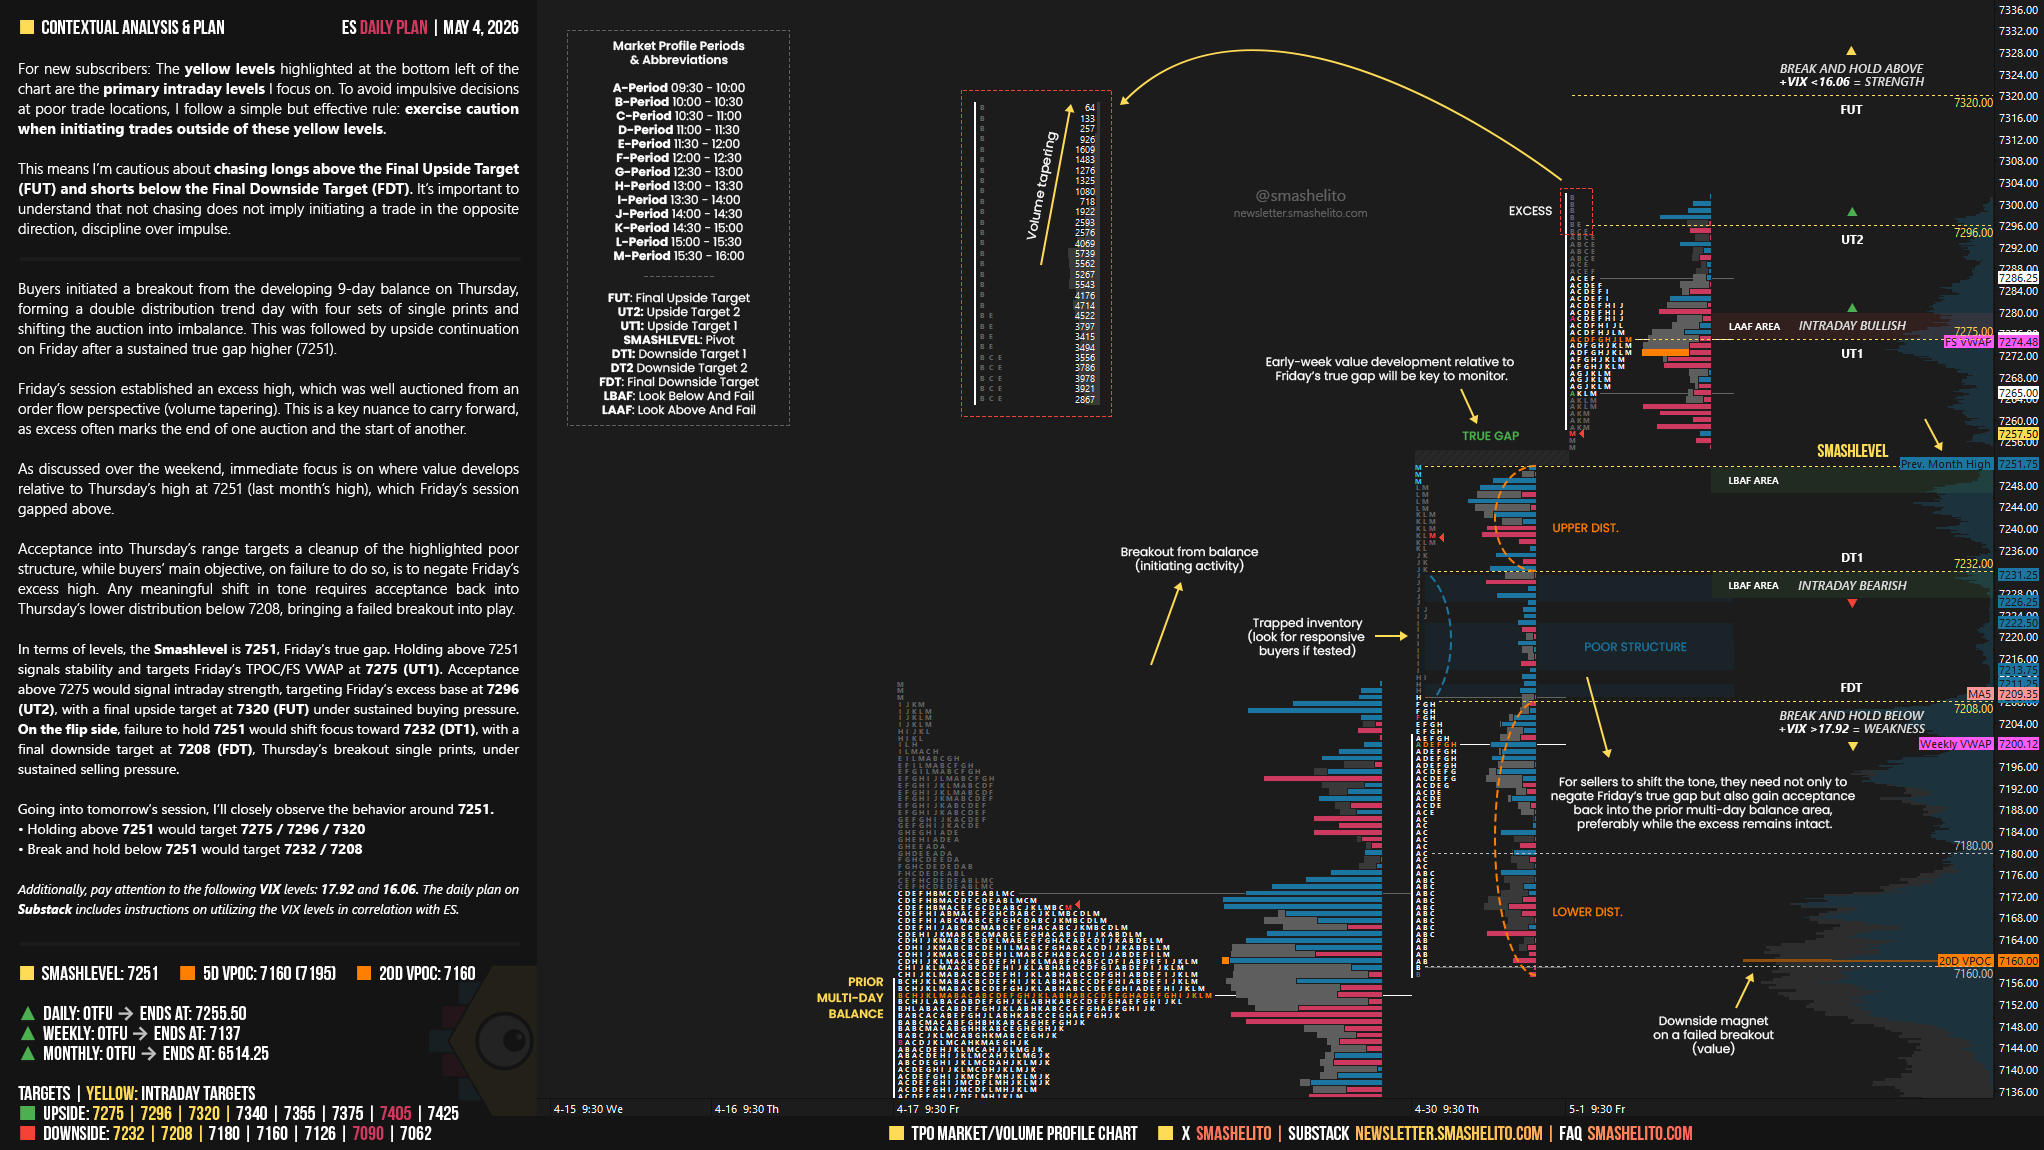
The yellow levels highlighted at the bottom left of the chart are the primary intraday levels I focus on. To avoid impulsive decisions at poor trade locations, I follow a simple but effective rule: exercise caution when initiating trades outside of these yellow levels.
This means I’m cautious about chasing longs above the Final Upside Target (FUT) and shorts below the Final Downside Target (FDT). It’s important to understand that not chasing does not imply initiating a trade in the opposite direction, discipline over impulse.
Be sure to review the Weekly Plan for a broader perspective, key levels, and market expectations for the week ahead.

Contextual Analysis & Plan
Buyers initiated a breakout from the developing 9-day balance on Thursday, forming a double distribution trend day with four sets of single prints and shifting the auction into imbalance. This was followed by upside continuation on Friday after a sustained true gap higher (7251).
Friday’s session established an excess high, which was well auctioned from an order flow perspective (volume tapering). This is a key nuance to carry forward, as excess often marks the end of one auction and the start of another.
Smashlevels Recap
As discussed over the weekend, immediate focus is on where value develops relative to Thursday’s high at 7251 (last month’s high), which Friday’s session gapped above.
Acceptance into Thursday’s range targets a cleanup of the highlighted poor structure, while buyers’ main objective, on failure to do so, is to negate Friday’s excess high.
Any meaningful shift in tone requires acceptance back into Thursday’s lower distribution below 7208, bringing a failed breakout into play.
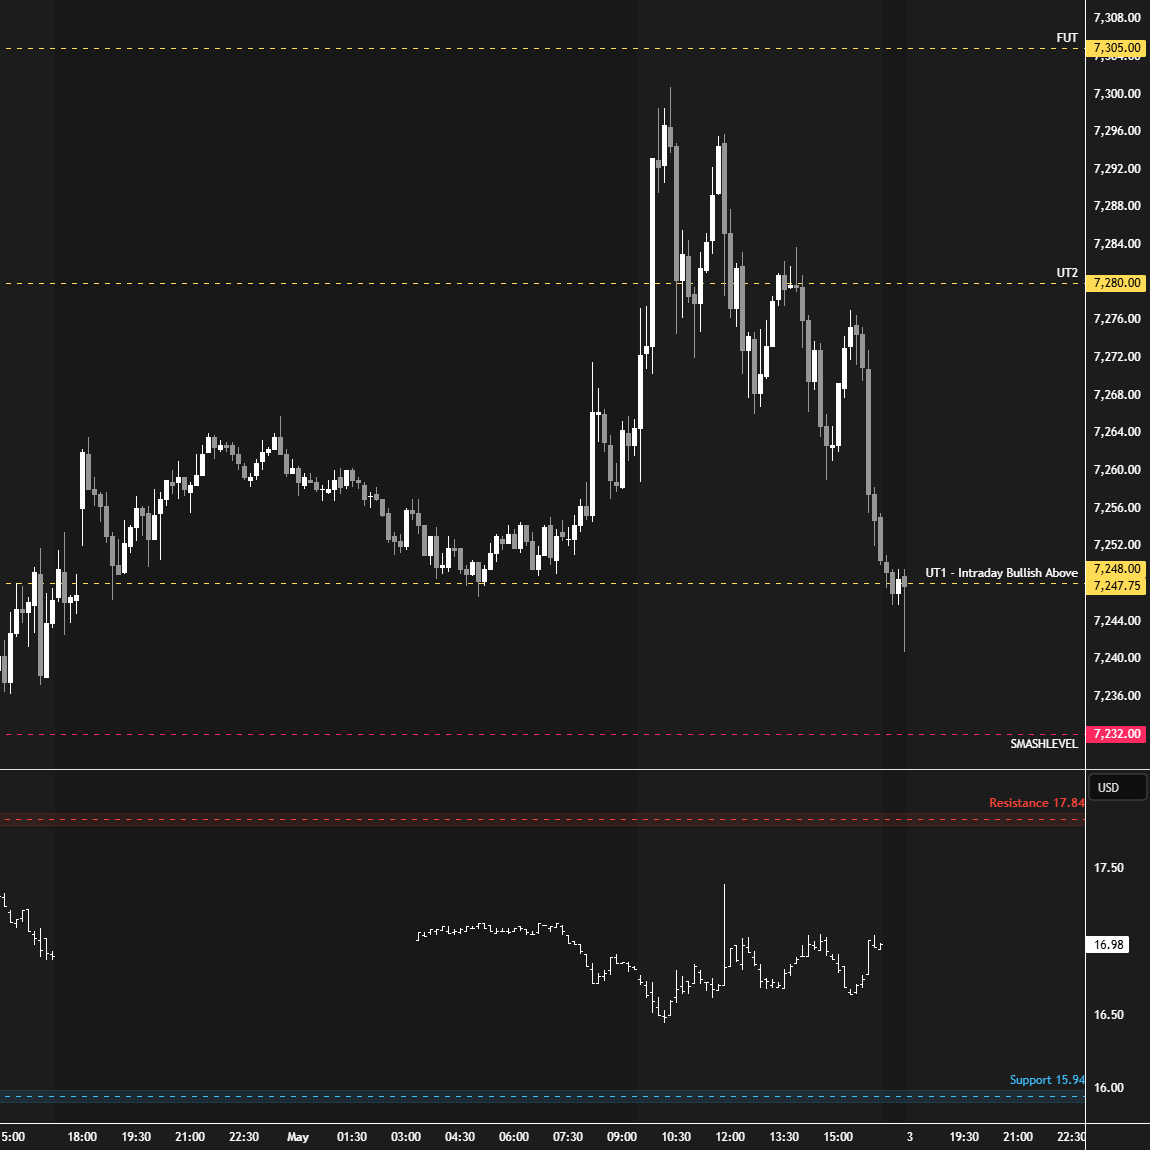
In terms of levels, the Smashlevel is 7251, Friday’s true gap. Holding above 7251 signals stability and targets Friday’s TPOC/FS VWAP at 7275 (UT1). Acceptance above 7275 would signal intraday strength, targeting Friday’s excess base at 7296 (UT2), with a final upside target at 7320 (FUT) under sustained buying pressure.
On the flip side, failure to hold 7251 would shift focus toward 7232 (DT1), with a final downside target at 7208 (FDT), Thursday’s breakout single prints, under sustained selling pressure.
Visual Representation
Levels of Interest
Going into tomorrow’s session, I’ll closely observe the behavior around 7251.
Holding above 7251 would target 7275 / 7296 / 7320
Break and hold below 7251 would target 7232 / 7208
Additionally, pay attention to the following VIX levels: 17.92 and 16.06. These levels can provide confirmation of strength or weakness.
Break and hold above 7320 with VIX below 16.06 would confirm strength.
Break and hold below 7208 with VIX above 17.92 would confirm weakness.
Overall, it's important to exercise caution when trading outside of the highlighted yellow levels. A non-cooperative VIX may suggest possible reversals i.e trade setups.
NQ four handles shy of that level at the open …. 9 pts closer than 5/1 RTH open
As always, thank you Smash! The market takes baby steps, and the first step was placing the Daily into balance. However, in this environment, we have to play it day by day and assess what the MGI is telling us. As you always stress, reading how value develops each day is key. Being in balance could simply mean bulls are shaking out weak hands and searching for new buyers. I’ll definitely be paying close attention to tomorrow’s levels!