
ES Daily Plan | May 30, 2025
Key Levels & Market Context for the Upcoming Session.

For new followers: The yellow levels highlighted at the bottom left of the chart are the primary levels that I focus on intraday. My strategy for preventing impulsive decisions at unfavorable locations involves following a simple yet effective rule of exercising caution when initiating trades outside of the yellow levels. This implies that I am cautious chasing longs above the final upside target (FUT) and shorts below the final downside target (FDT). It is crucial to understand that refraining from chasing a trade is not an automatic invitation to initiate a trade in the opposite direction.
Make sure to review the Weekly Plan, which provides a broader perspective and highlights key levels of interest to observe in the upcoming week.

Visual Representation
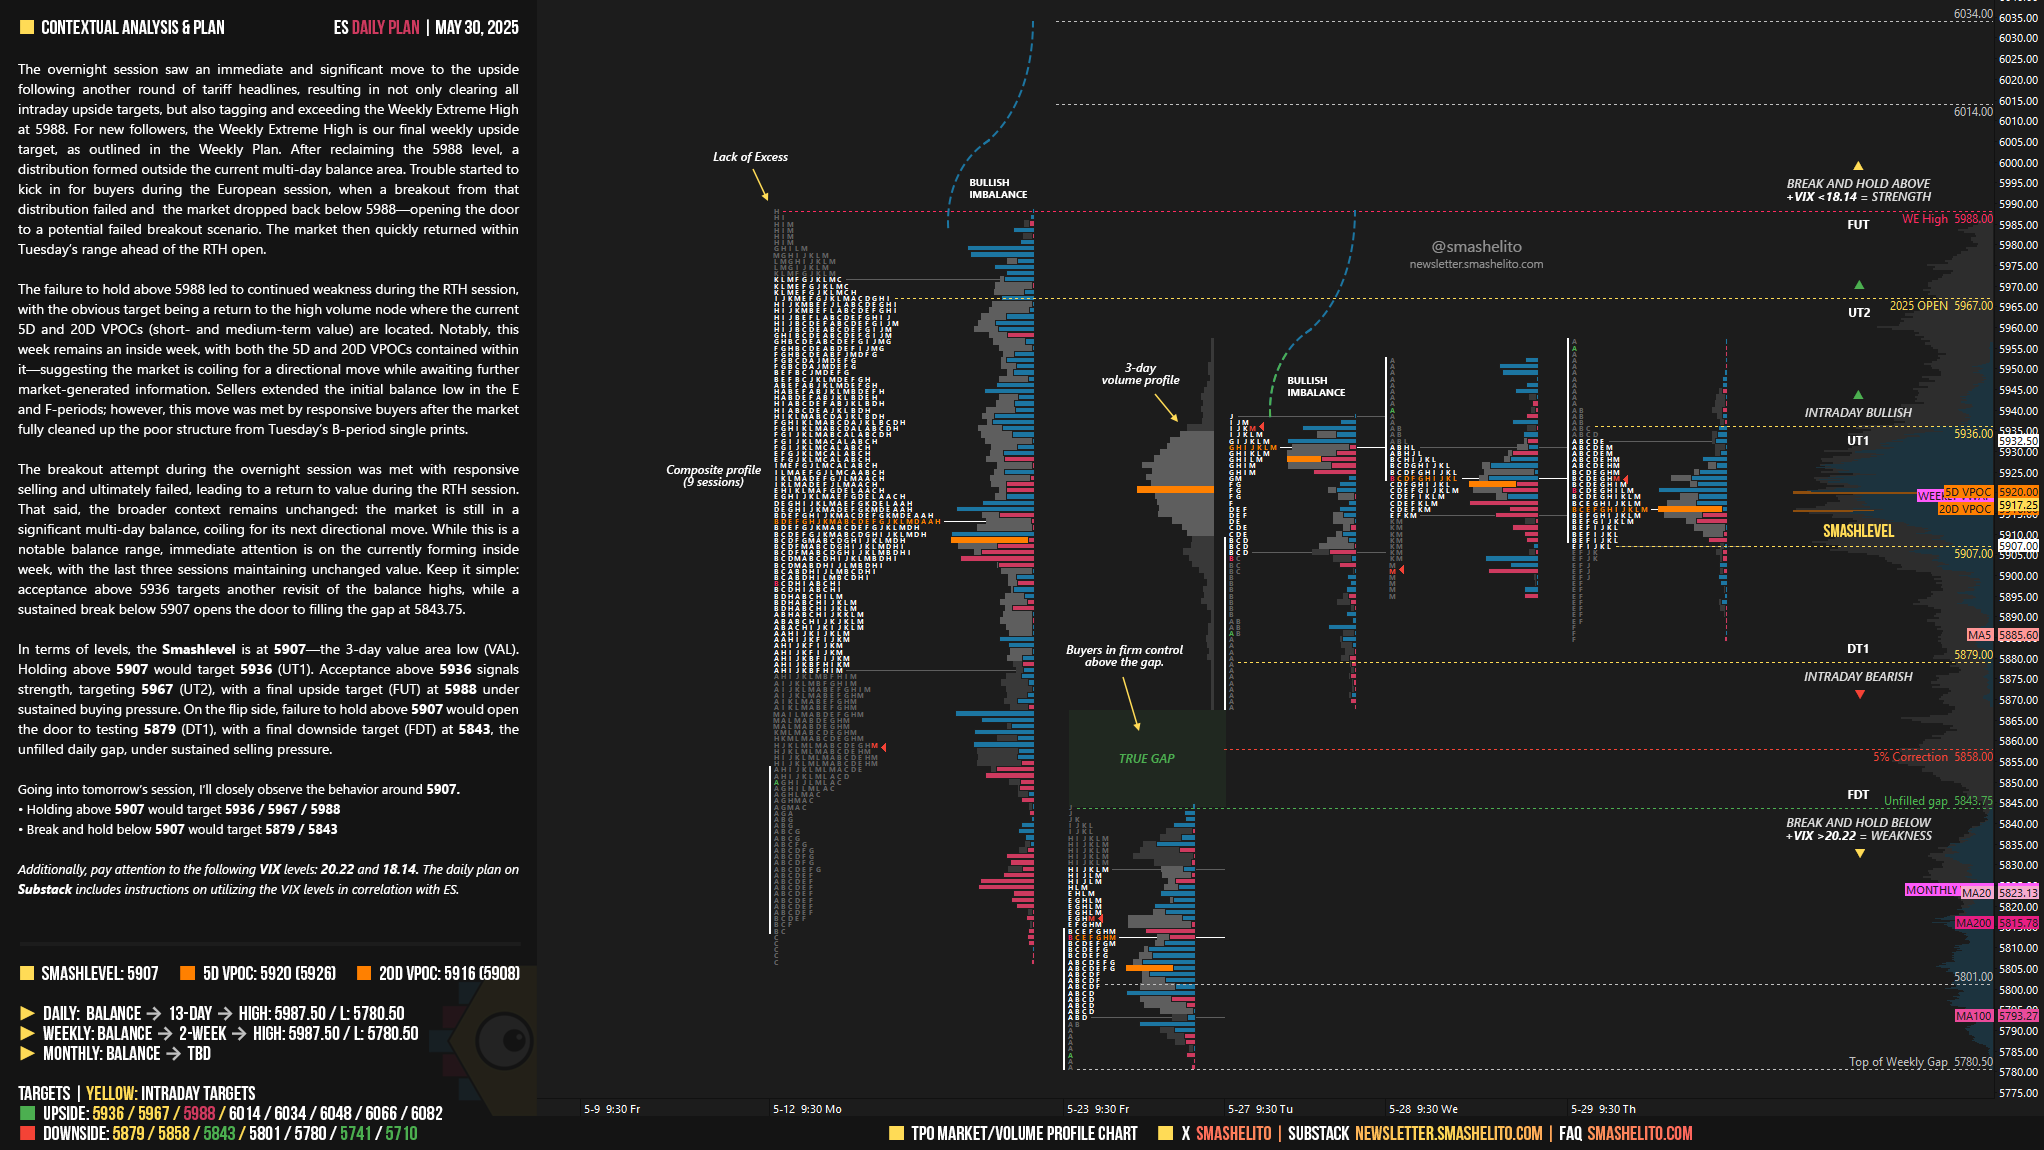
Contextual Analysis & Plan
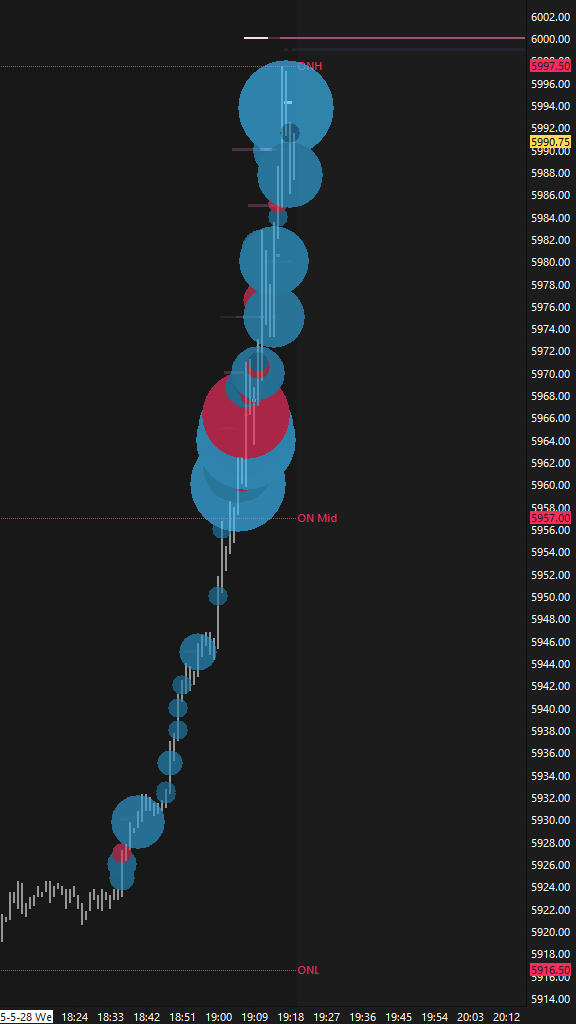
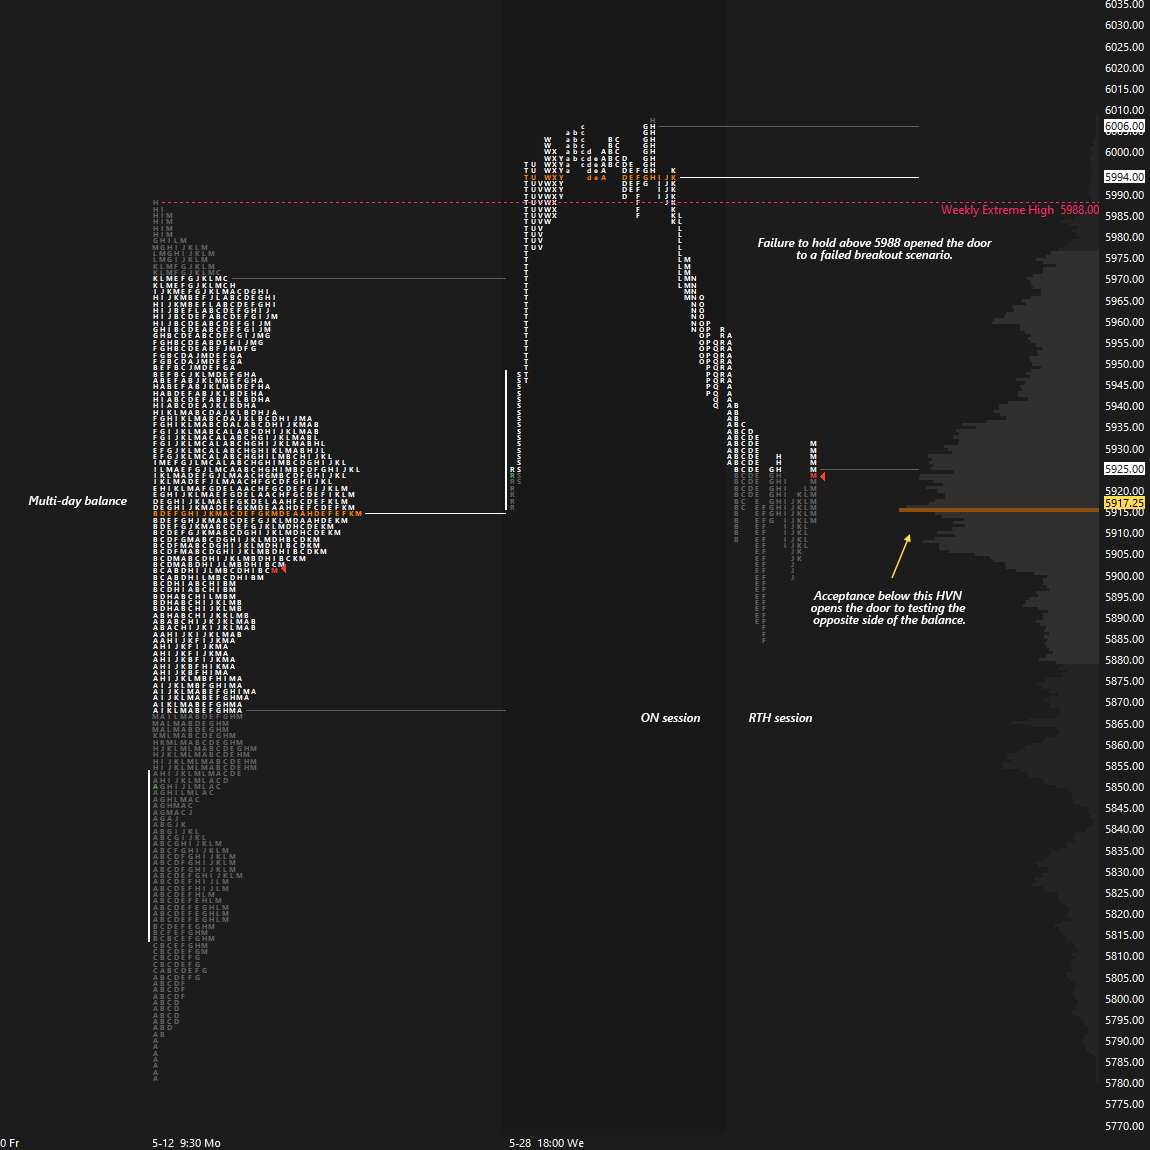
The overnight session saw an immediate and significant move to the upside following another round of tariff headlines, resulting in not only clearing all intraday upside targets, but also tagging and exceeding the Weekly Extreme High at 5988 (see Figure 1). For new followers, the Weekly Extreme High is our final weekly upside target, as outlined in the Weekly Plan. After reclaiming the 5988 level, a distribution formed outside the current multi-day balance area. Trouble started to kick in for buyers during the European session, when a breakout from that distribution failed and the market dropped back below 5988—opening the door to a potential failed breakout scenario (see Figure 2). The market then quickly returned within Tuesday’s range ahead of the RTH open.
The failure to hold above 5988 led to continued weakness during the RTH session, with the obvious target being a return to the high volume node where the current 5D and 20D VPOCs (short- and medium-term value) are located. Notably, this week remains an inside week, with both the 5D and 20D VPOCs contained within it—suggesting the market is coiling for a directional move while awaiting further market-generated information. Sellers extended the initial balance low in the E and F-periods; however, this move was met by responsive buyers after the market fully cleaned up the poor structure from Tuesday’s B-period single prints.
The breakout attempt during the overnight session was met with responsive selling and ultimately failed, leading to a return to value during the RTH session. That said, the broader context remains unchanged: the market is still in a significant multi-day balance, coiling for its next directional move. While this is a notable balance range, immediate attention is on the currently forming inside week, with the last three sessions maintaining unchanged value. Keep it simple: acceptance above 5936 targets another revisit of the balance highs, while a sustained break below 5907 opens the door to filling the gap at 5843.75.
In terms of levels, the Smashlevel is at 5907—the 3-day value area low (VAL). Holding above 5907 would target 5936 (UT1). Acceptance above 5936 signals strength, targeting 5967 (UT2), with a final upside target (FUT) at 5988 under sustained buying pressure. On the flip side, failure to hold above 5907 would open the door to testing 5879 (DT1), with a final downside target (FDT) at 5843, the unfilled daily gap, under sustained selling pressure.
Levels of Interest
Going into tomorrow’s session, I’ll closely observe the behavior around 5907.
Holding above 5907 would target 5936 / 5967 / 5988
Break and hold below 5907 would target 5879 / 5843
Additionally, pay attention to the following VIX levels: 20.22 and 18.14. These levels can provide confirmation of strength or weakness.
Break and hold above 5988 with VIX below 18.14 would confirm strength.
Break and hold below 5843 with VIX above 20.22 would confirm weakness.
Overall, it's important to exercise caution when trading outside of the highlighted yellow levels. A non-cooperative VIX may suggest possible reversals i.e trade setups.
Thank you Smash! You forgot to mention the VIX testing that support level overnight.
Thank you ssssoooo much.