
ES Daily Plan | May 28, 2025
Key Levels & Market Context for the Upcoming Session.

For new followers: The yellow levels highlighted at the bottom left of the chart are the primary levels that I focus on intraday. My strategy for preventing impulsive decisions at unfavorable locations involves following a simple yet effective rule of exercising caution when initiating trades outside of the yellow levels. This implies that I am cautious chasing longs above the final upside target (FUT) and shorts below the final downside target (FDT). It is crucial to understand that refraining from chasing a trade is not an automatic invitation to initiate a trade in the opposite direction.
Make sure to review the Weekly Plan, which provides a broader perspective and highlights key levels of interest to observe in the upcoming week.

Visual Representation
Contextual Analysis & Plan
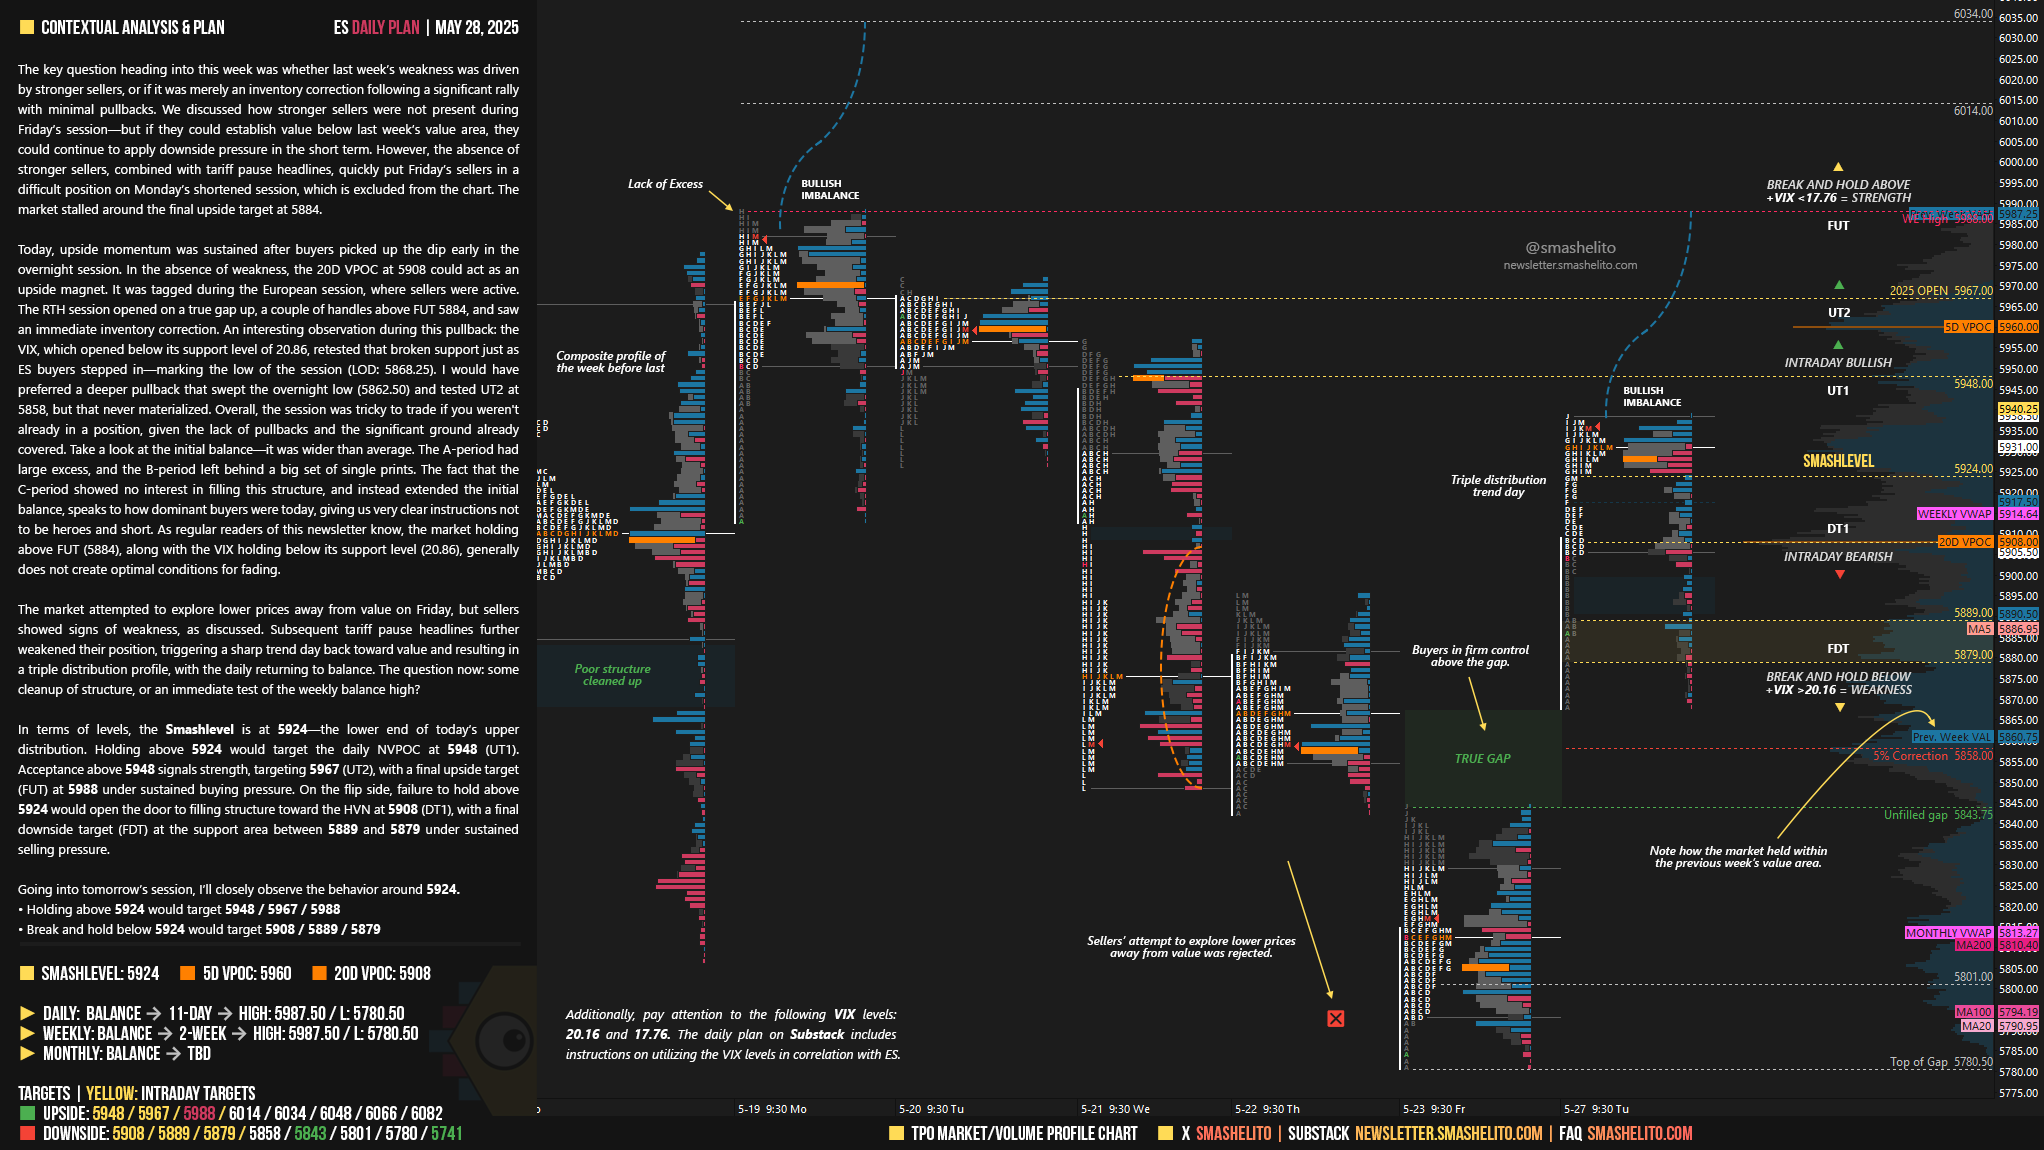
The key question heading into this week was whether last week’s weakness was driven by stronger sellers, or if it was merely an inventory correction following a significant rally with minimal pullbacks. We discussed how stronger sellers were not present during Friday’s session—but if they could establish value below last week’s value area, they could continue to apply downside pressure in the short term. However, the absence of stronger sellers, combined with tariff pause headlines, quickly put Friday’s sellers in a difficult position on Monday’s shortened session, which is excluded from the chart. The market stalled around the final upside target at 5884.
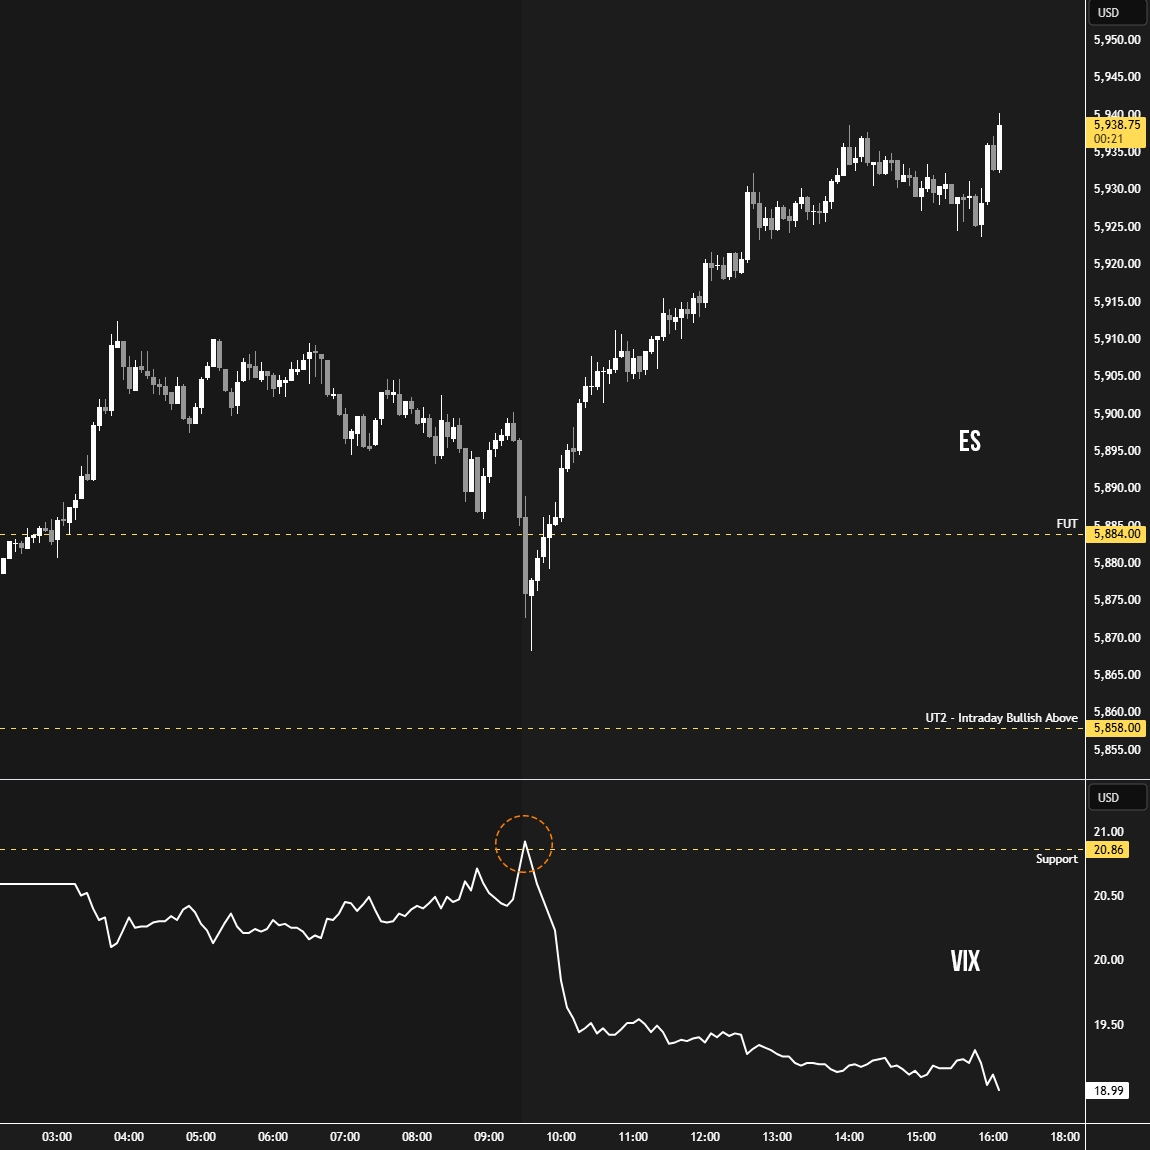
Today, upside momentum was sustained after buyers picked up the dip early in the overnight session. In the absence of weakness, the 20D VPOC at 5908 could act as an upside magnet. It was tagged during the European session, where sellers were active. The RTH session opened on a true gap up, a couple of handles above FUT 5884, and saw an immediate inventory correction. An interesting observation during this pullback: the VIX, which opened below its support level of 20.86, retested that broken support just as ES buyers stepped in—marking the low of the session (LOD: 5868.25) (see Figure 1). I would have preferred a deeper pullback that swept the overnight low (5862.50) and tested UT2 at 5858, but that never materialized. Overall, the session was tricky to trade if you weren't already in a position, given the lack of pullbacks and the significant ground already covered. Take a look at the initial balance—it was wider than average. The A-period had large excess, and the B-period left behind a big set of single prints. The fact that the C-period showed no interest in filling this structure, and instead extended the initial balance, speaks to how dominant buyers were today, giving us very clear instructions not to be heroes and short. As regular readers of this newsletter know, the market holding above FUT (5884), along with the VIX holding below its support level (20.86), generally does not create optimal conditions for fading.
The market attempted to explore lower prices away from value on Friday, but sellers showed signs of weakness, as discussed. Subsequent tariff pause headlines further weakened their position, triggering a sharp trend day back toward value and resulting in a triple distribution profile, with the daily returning to balance. The question now: some cleanup of structure, or an immediate test of the weekly balance high?
In terms of levels, the Smashlevel is at 5924—the lower end of today’s upper distribution. Holding above 5924 would target the daily NVPOC at 5948 (UT1). Acceptance above 5948 signals strength, targeting 5967 (UT2), with a final upside target (FUT) at 5988 under sustained buying pressure. On the flip side, failure to hold above 5924 would open the door to filling structure toward the HVN at 5908 (DT1), with a final downside target (FDT) at the support area between 5889 and 5879 under sustained selling pressure.
Levels of Interest
Going into tomorrow’s session, I’ll closely observe the behavior around 5924.
Holding above 5924 would target 5948 / 5967 / 5988
Break and hold below 5924 would target 5908 / 5889 / 5879
Additionally, pay attention to the following VIX levels: 20.16 and 17.76. These levels can provide confirmation of strength or weakness.
Break and hold above 5988 with VIX below 17.76 would confirm strength.
Break and hold below 5879 with VIX above 20.16 would confirm weakness.
Overall, it's important to exercise caution when trading outside of the highlighted yellow levels. A non-cooperative VIX may suggest possible reversals i.e trade setups.
Thank you Smash!
Thank you Lito!
I am a bit late - best wishes trading today!