
ES Daily Plan | May 22, 2025
Key Levels & Market Context for the Upcoming Session.

For new followers: The yellow levels highlighted at the bottom left of the chart are the primary levels that I focus on intraday. My strategy for preventing impulsive decisions at unfavorable locations involves following a simple yet effective rule of exercising caution when initiating trades outside of the yellow levels. This implies that I am cautious chasing longs above the final upside target (FUT) and shorts below the final downside target (FDT). It is crucial to understand that refraining from chasing a trade is not an automatic invitation to initiate a trade in the opposite direction.
Make sure to review the Weekly Plan, which provides a broader perspective and highlights key levels of interest to observe in the upcoming week.

Visual Representation

Contextual Analysis & Plan
The overnight session was marked by weakness following the failure to remain within Tuesday’s value area and to hold above the low volume node at 5949—the Smashlevel for the session. The overnight weakness resulted in an inside day breakdown, leading to testing the final downside target at 5905 to the tick, where passive buyers were waiting (see Figure 1). The 5905 level provided a solid bounce; however, this move was retraced pre-open. As reiterated on X and Substack notes, 5905 was the key level sellers needed to break in order to trigger further downside pressure.
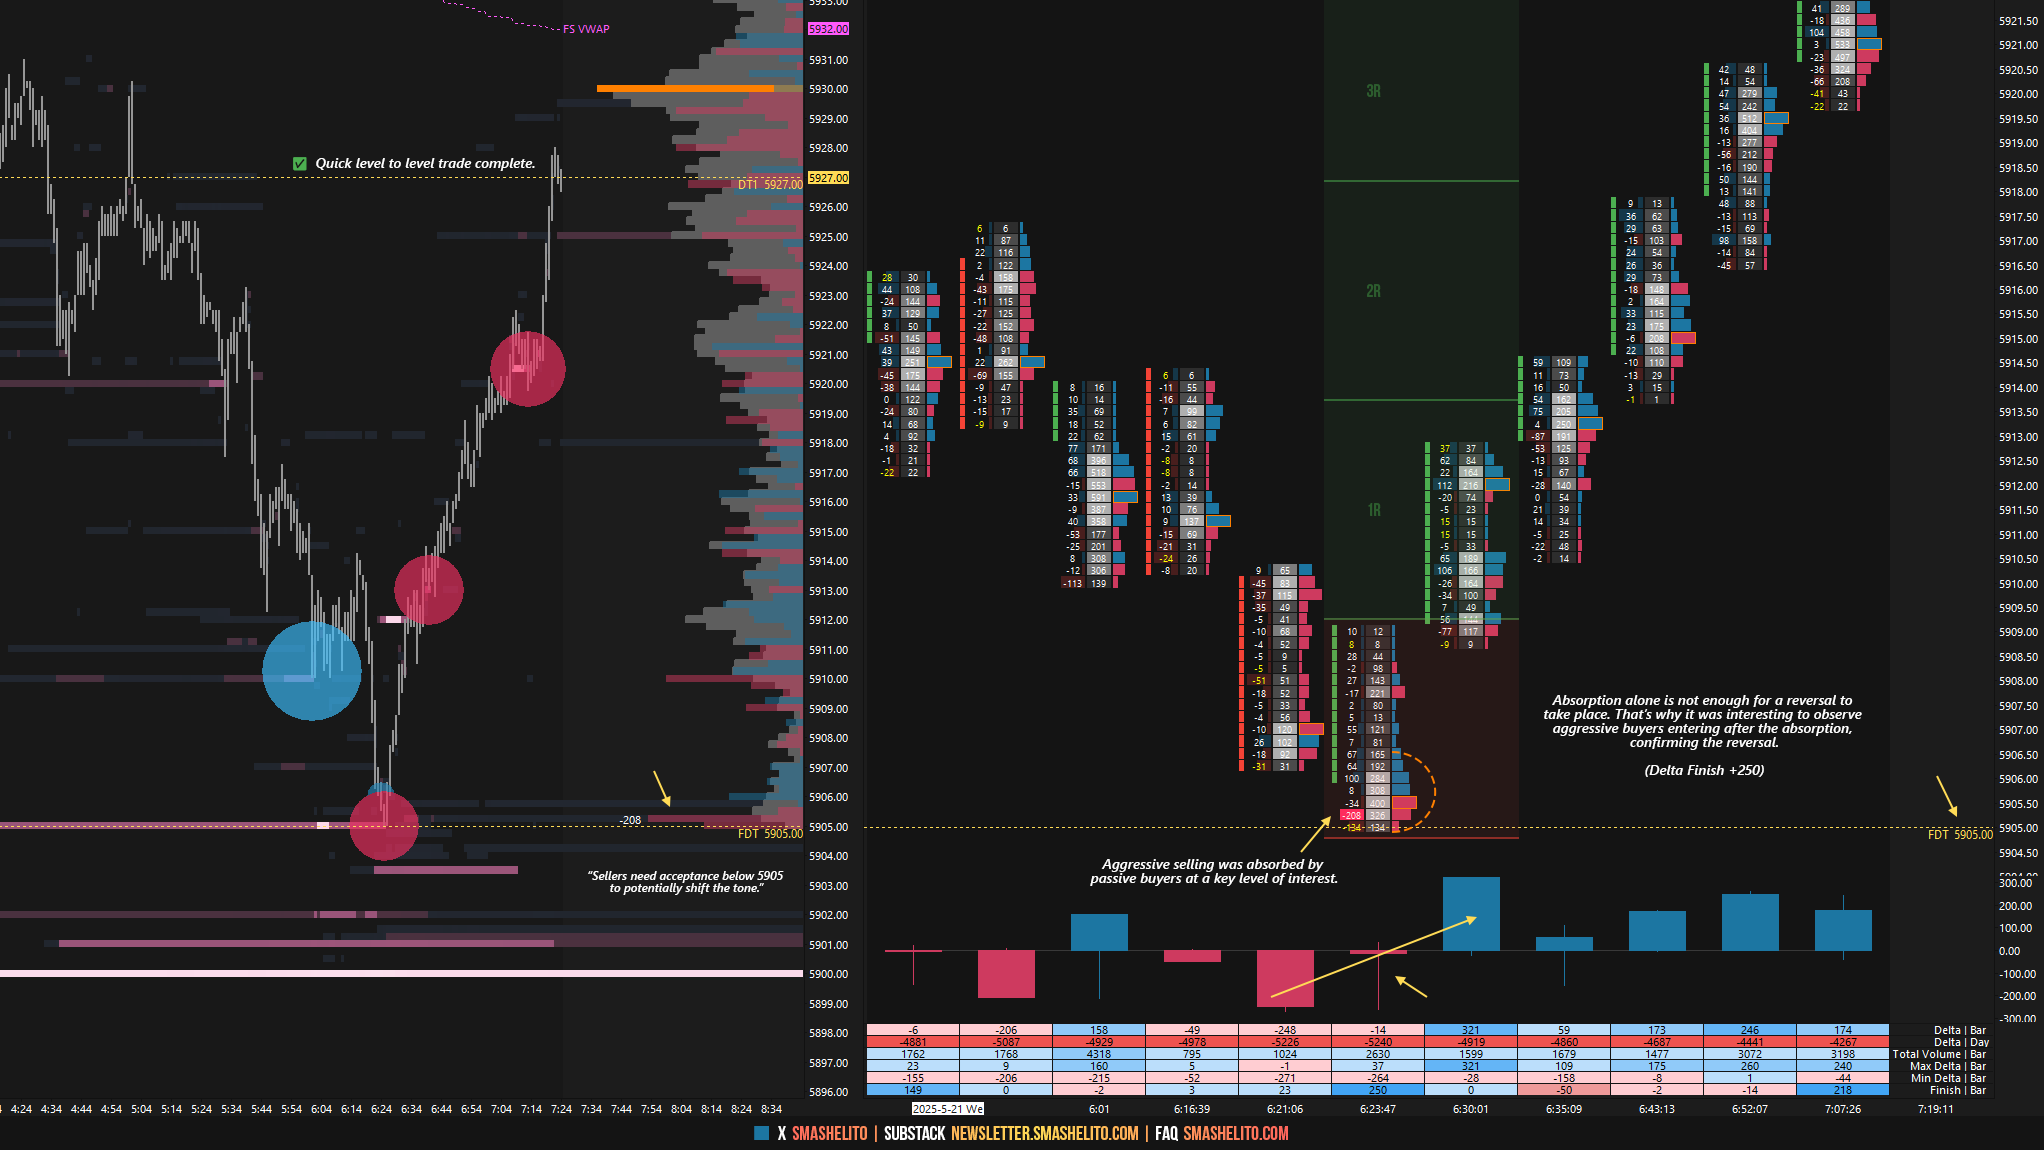
The RTH session opened on a true gap down, meaning outside of the previous day’s range. This occurred twice last week, and both times sellers got smashed due to a lack of downside follow-through. Today, it initially looked like it would be a third straight seller smash—but this time, they had other plans. Buyers controlled the auction during the morning session, extending the initial balance to the upside. The key battle of the day unfolded around our intraday pivot at 5949, where passive sellers absorbed a notable buying effort, defending the attempt to re-enter Tuesday’s value area. Change took place in the H-period, when a liquidation break decisively broke the crucial 5905 level. This break was accompanied by the VIX breaking its resistance level at 19.06, confirming weakness. The next level of interest at 5875 provided a bounce, leading to a retest of 5905—which offered an excellent short setup in confluence with the VIX retesting its broken resistance (see Figure 2 & 3). The session closed at its lows, with all poor structure from last week cleaned up in the process. While the daily is now one-time framing down, it’s important to note that the weekly remains one-time framing up as long as last week’s low at 5805.75 is not breached. This means that while sellers have shifted the tone in the short term, they still have a lot of work to do—including filling last week’s large gap. The real trouble for buyers kicks in if that gap is filled and acceptance is established below 5741.


What initially looked like another failed inside day breakdown ultimately resulted in a double distribution trend day down, following the break of the key 5905 level. The key question now is whether sellers can follow through. A weak market would build value below last week’s value area (5875), targeting the cessation of the weekly one-time framing up, which is the top of last week’s gap. Failure to do so would open the door for a return to 5908.
In terms of levels, the Smashlevel is at 5875—today’s TPOC, aligning with last week’s VAL. Holding below 5875 signals weakness, targeting 5836 (DT1), with a final downside target (FDT) at the support area between 5815 and 5806 under sustained selling pressure. On the flip side, reclaiming and holding above 5875 would target a return to the resistance area between 5905 and 5915 (FUT).
Levels of Interest
Going into tomorrow’s session, I’ll closely observe the behavior around 5875.
Break and hold above 5875 would target 5905 / 5915
Holding below 5875 would target 5836 / 5815 / 5806
Additionally, pay attention to the following VIX levels: 21.96 and 19.78. These levels can provide confirmation of strength or weakness.
Break and hold above 5915 with VIX below 19.78 would confirm strength.
Break and hold below 5806 with VIX above 21.96 would confirm weakness.
Overall, it's important to exercise caution when trading outside of the highlighted yellow levels. A non-cooperative VIX may suggest possible reversals i.e trade setups.
Fantastic stuff!
Great post!!! Very fine detail Smash! Question—is break and hold any particular interval? Like two 15’ ticks held above that level?