
ES Daily Plan | May 21, 2026
Market Context & Key Levels for the Day Ahead

— For new subscribers
The yellow levels highlighted at the bottom left of the chart are the primary intraday levels I focus on. To avoid impulsive decisions at poor trade locations, I follow a simple but effective rule: exercise caution when initiating trades outside of these yellow levels.
This means I’m cautious about chasing longs above the Final Upside Target (FUT) and shorts below the Final Downside Target (FDT). It’s important to understand that not chasing does not imply initiating a trade in the opposite direction, discipline over impulse.
Be sure to review the Weekly Plan for a broader perspective, key levels, and market expectations for the week ahead.

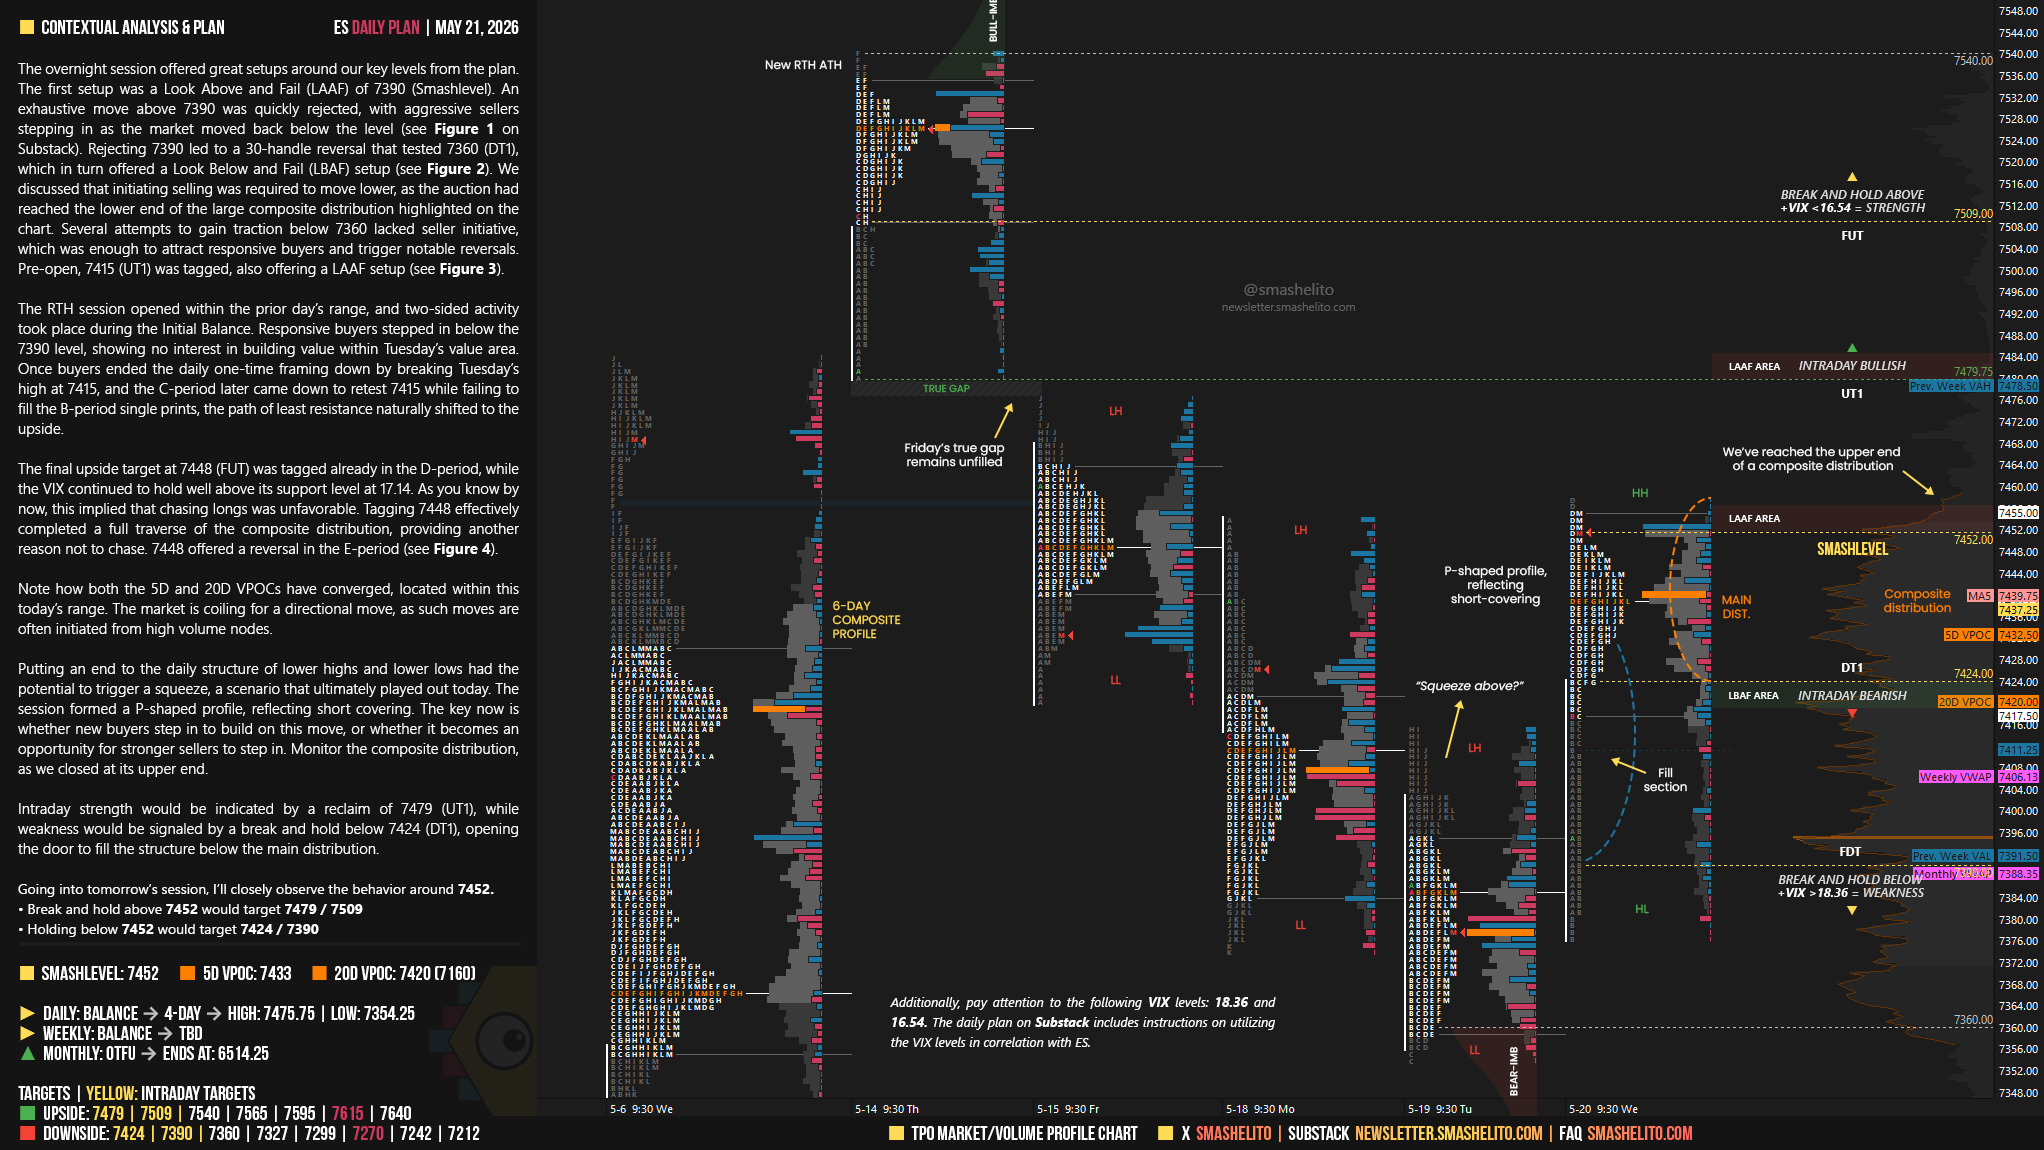
Contextual Analysis & Plan
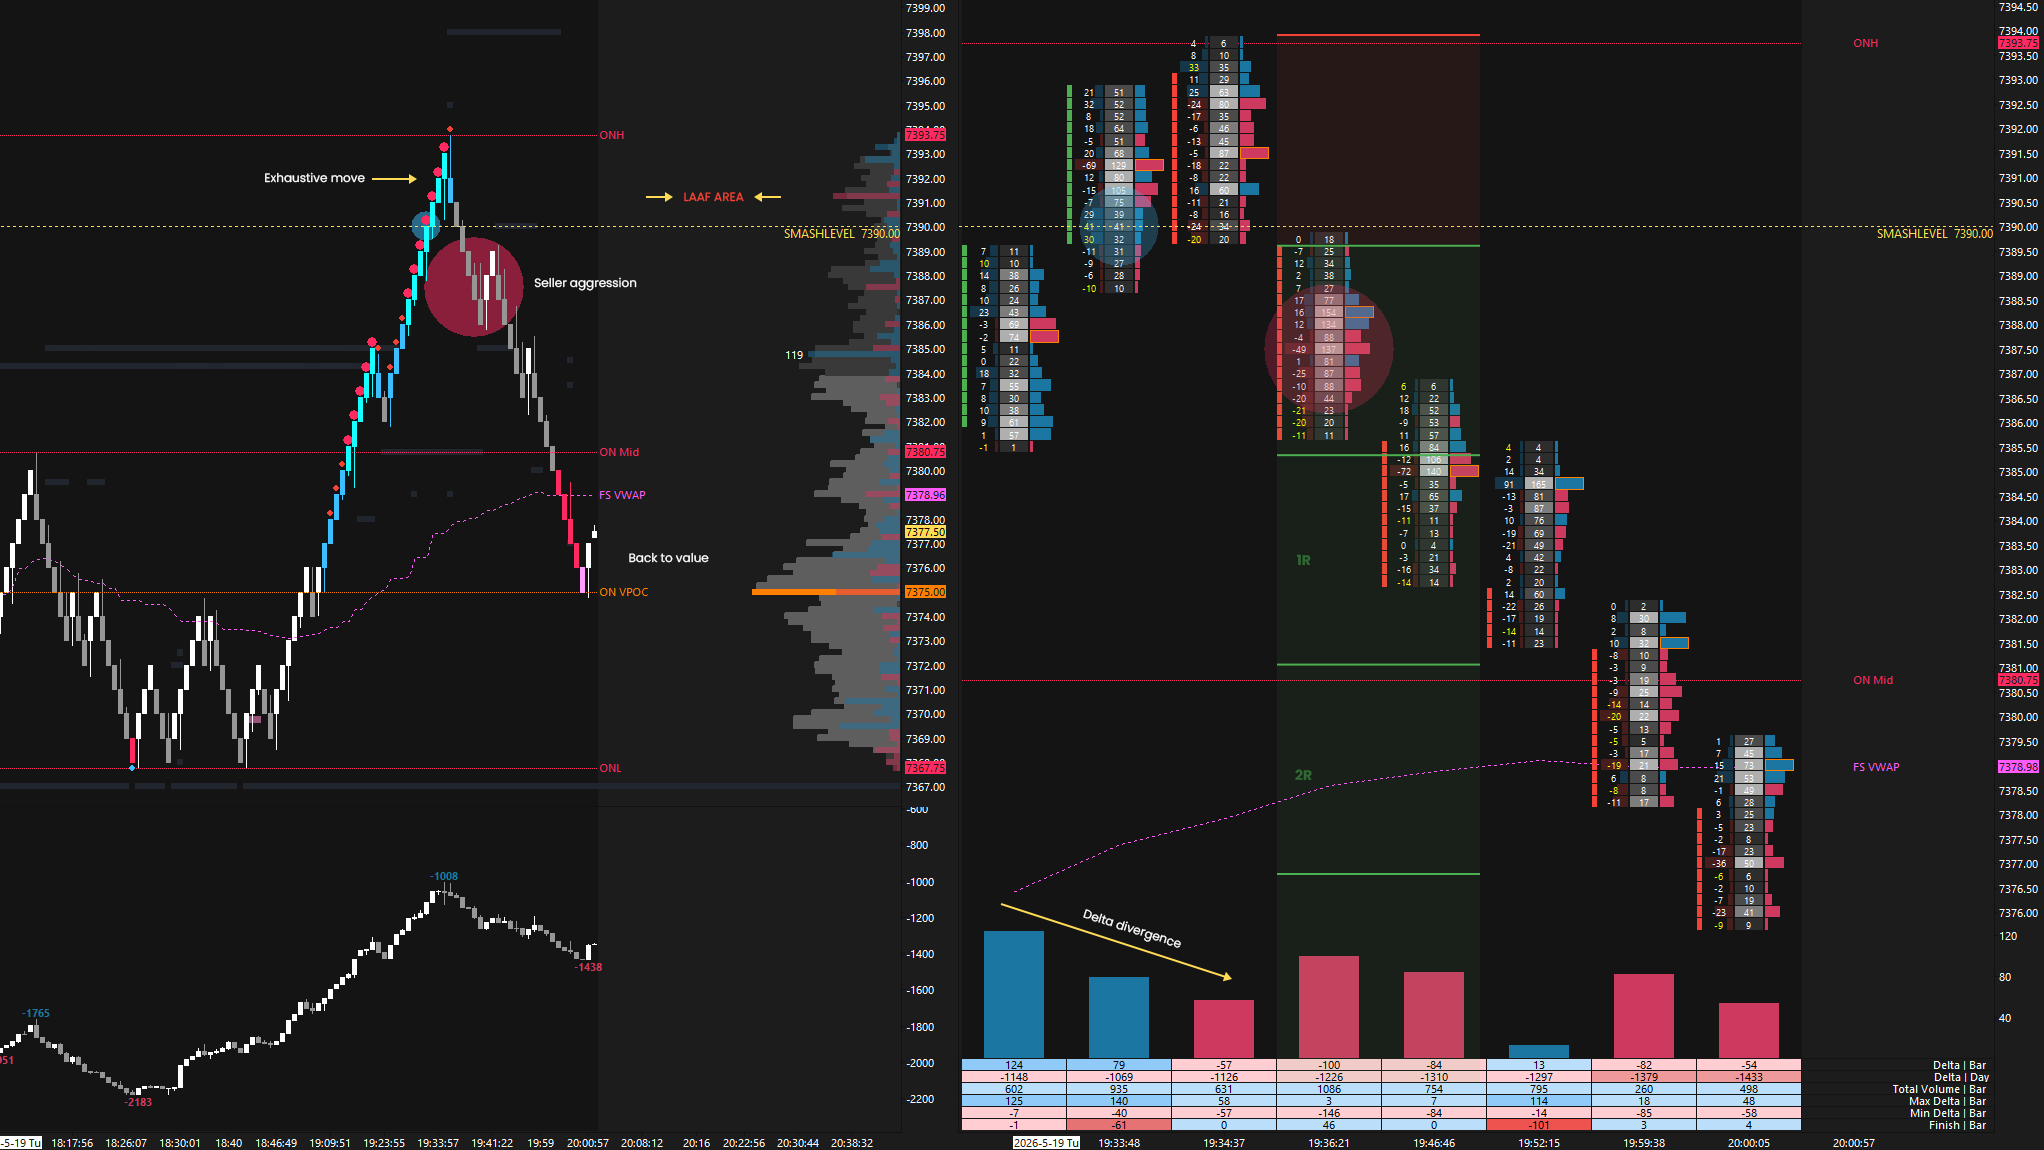
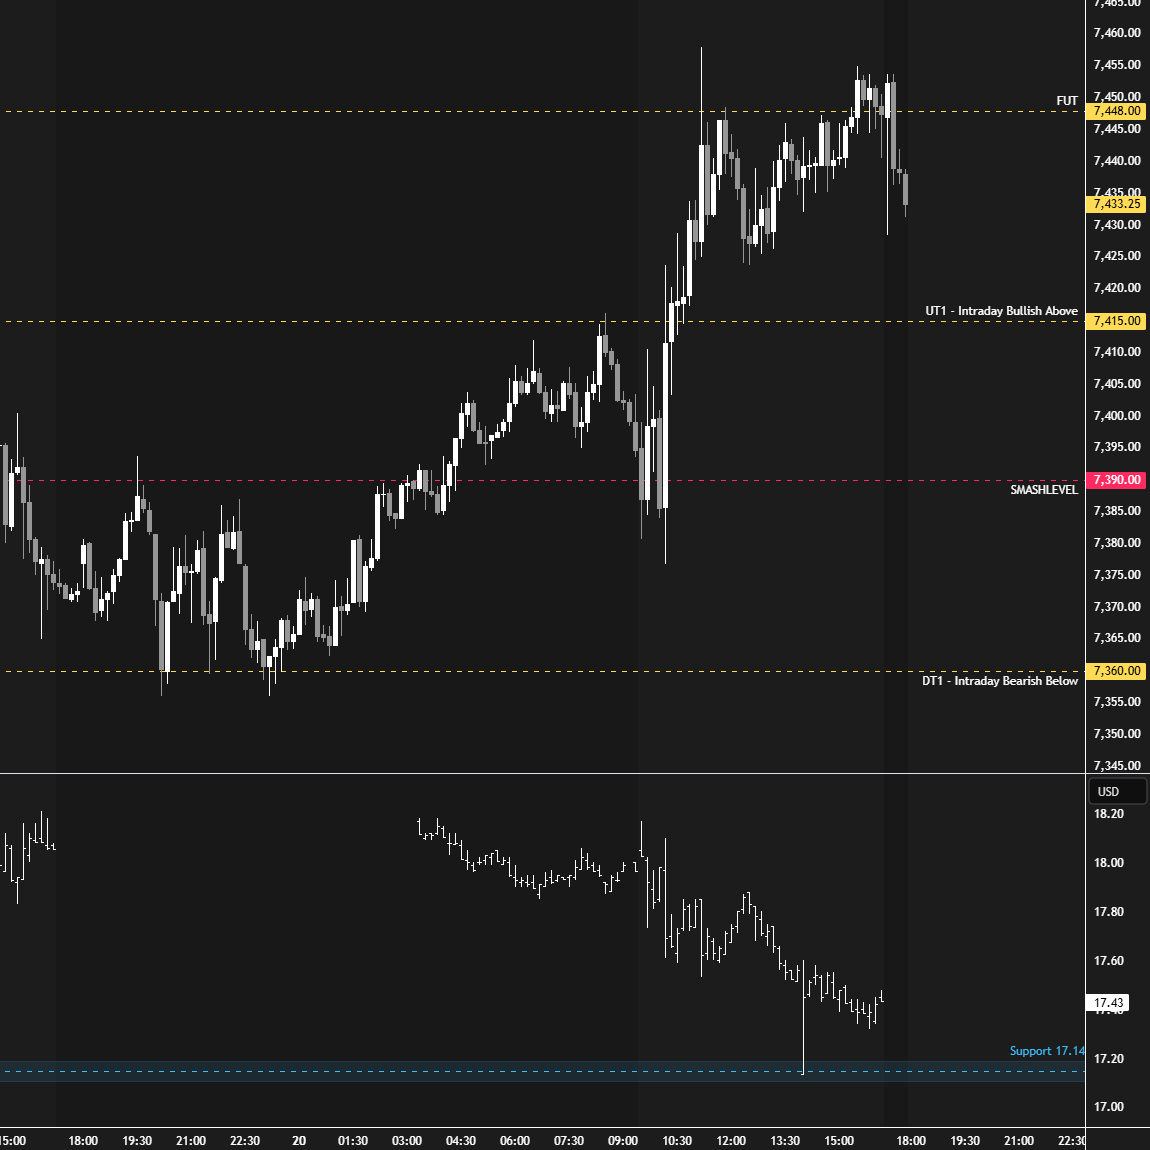
The overnight session offered great setups around our key levels from the plan. The first setup was a Look Above and Fail (LAAF) of 7390 (Smashlevel). An exhaustive move above 7390 was quickly rejected, with aggressive sellers stepping in as the market moved back below the level (see Figure 1).
Rejecting 7390 led to a 30-handle reversal that tested 7360 (DT1), which in turn offered a Look Below and Fail (LBAF) setup (see Figure 2).
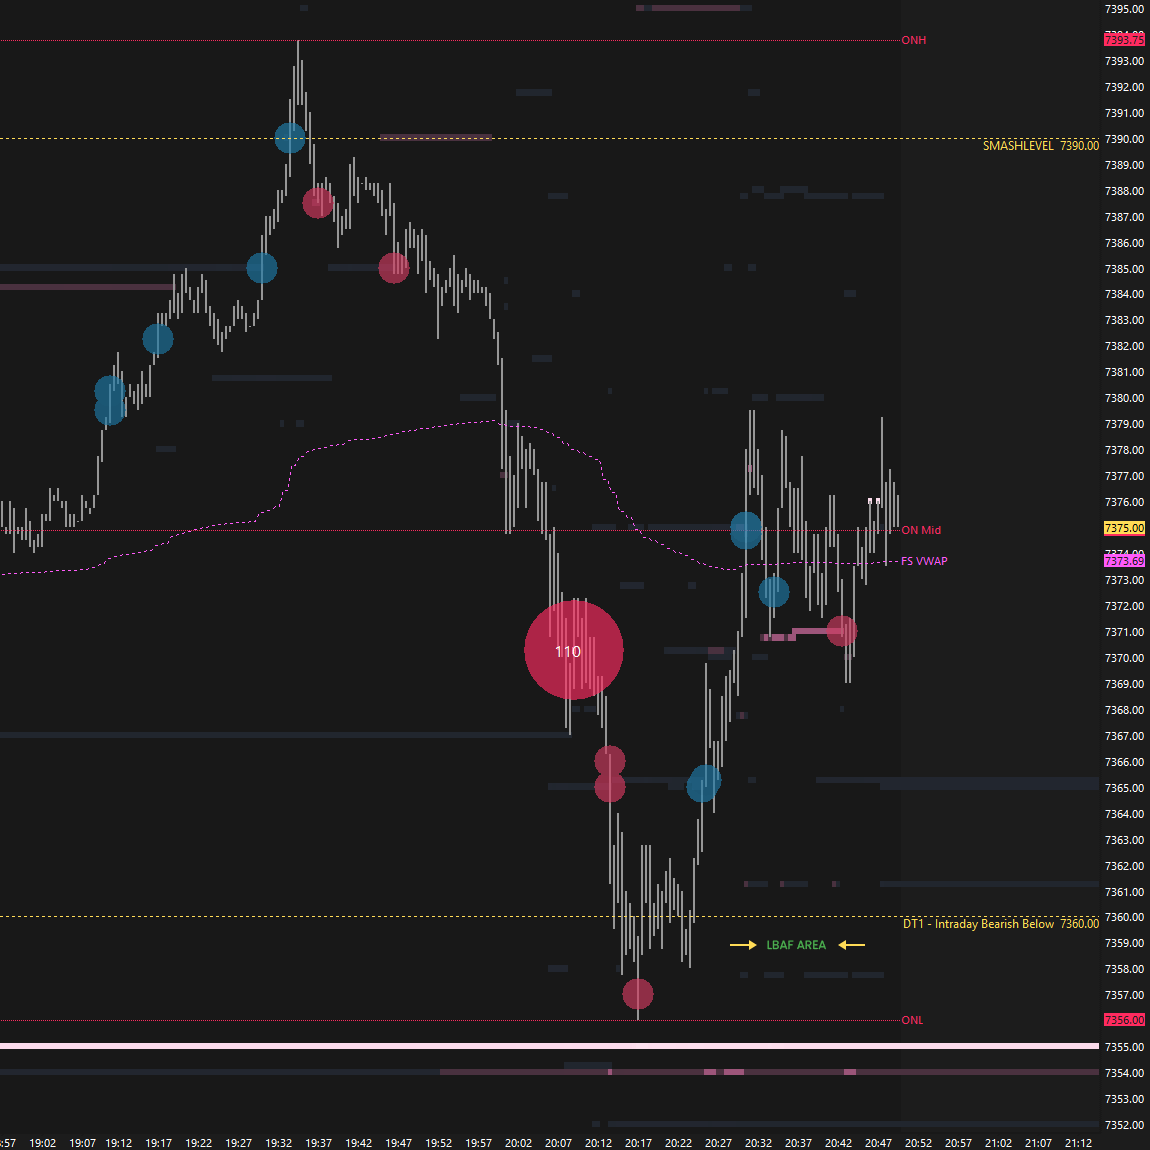
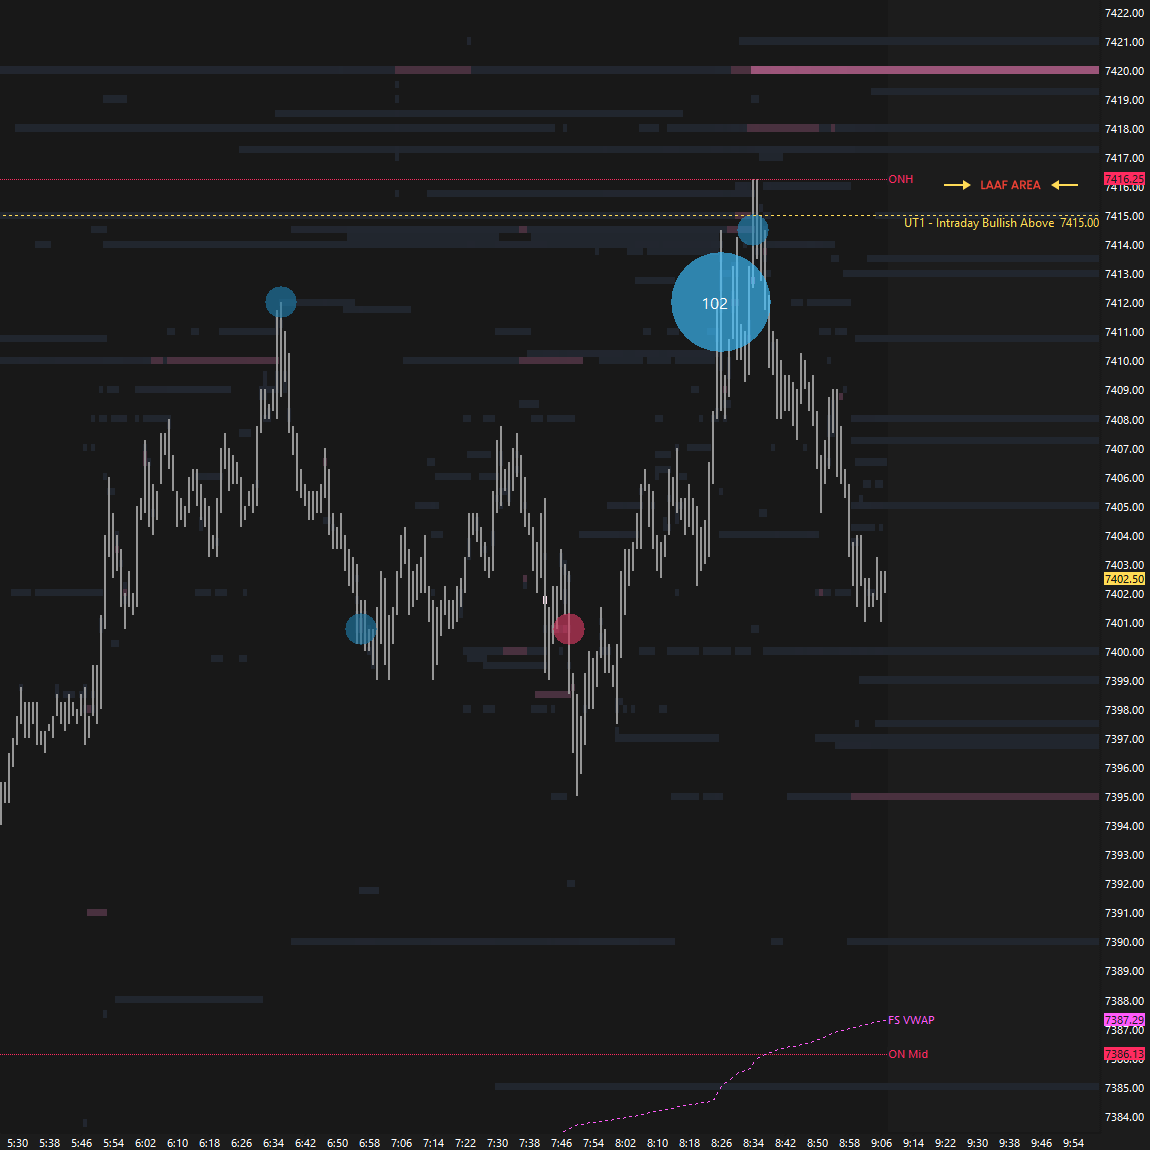
We discussed that initiating selling was required to move lower, as the auction had reached the lower end of the large composite distribution highlighted on the chart. Several attempts to gain traction below 7360 lacked seller initiative, which was enough to attract responsive buyers and trigger notable reversals. Pre-open, 7415 (UT1) was tagged, also offering a LAAF setup (see Figure 3).
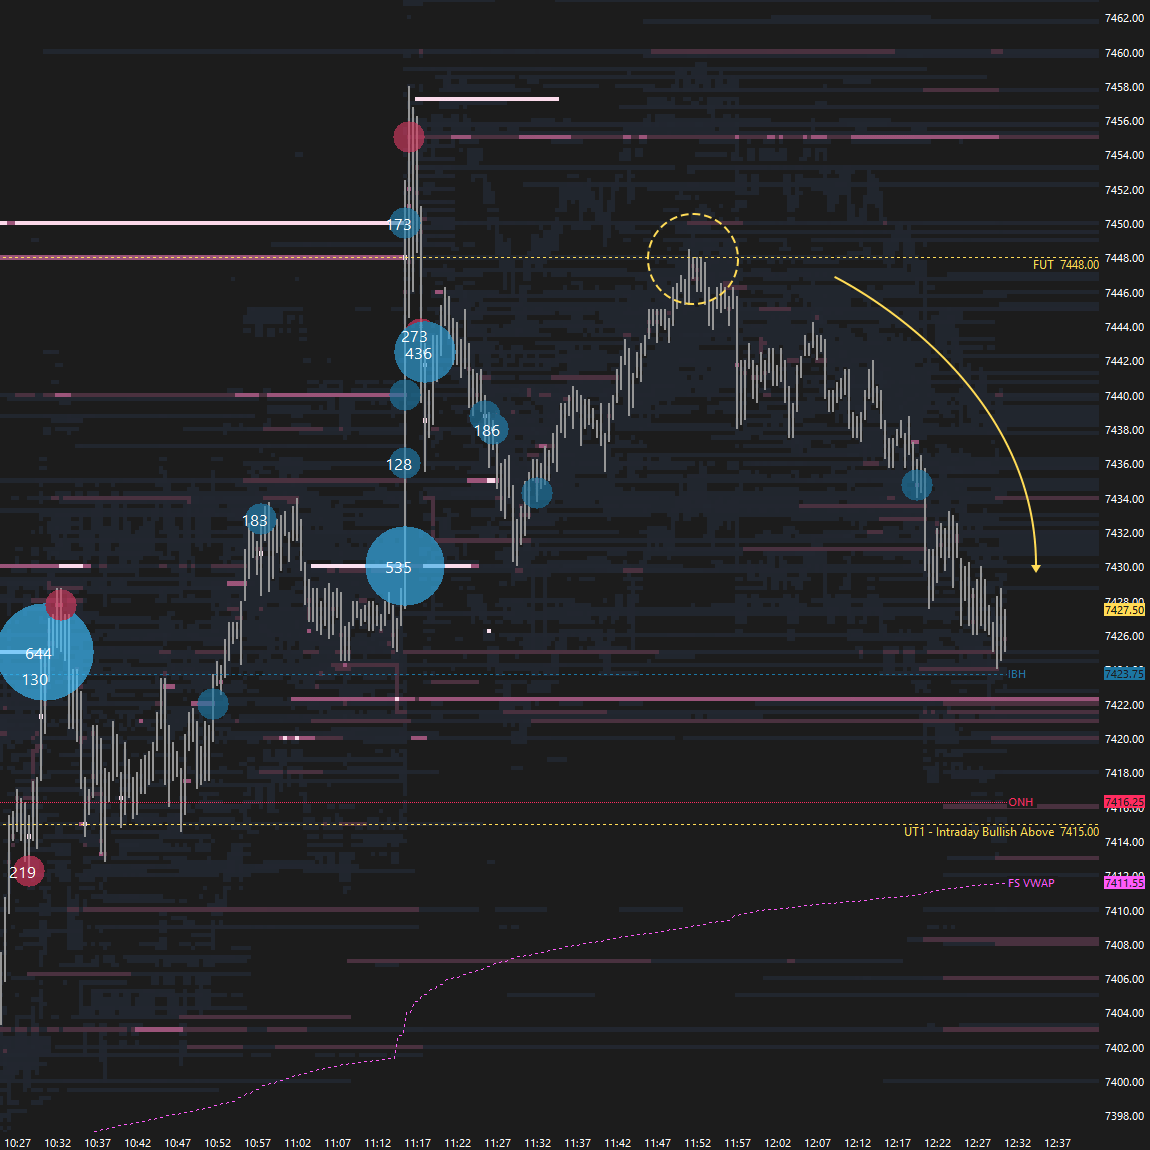
The RTH session opened within the prior day’s range, and two-sided activity took place during the Initial Balance. Responsive buyers stepped in below the 7390 level, showing no interest in building value within Tuesday’s value area. Once buyers ended the daily one-time framing down by breaking Tuesday’s high at 7415, and the C-period later came down to retest 7415 while failing to fill the B-period single prints, the path of least resistance naturally shifted to the upside.
The final upside target at 7448 (FUT) was tagged already in the D-period, while the VIX continued to hold well above its support level at 17.14. As you know by now, this implied that chasing longs was unfavorable. Tagging 7448 effectively completed a full traverse of the composite distribution, providing another reason not to chase. 7448 offered a reversal in the E-period (see Figure 4).
Note how both the 5D and 20D VPOCs have converged, located within this today’s range. The market is coiling for a directional move, as such moves are often initiated from high volume nodes.
Smashlevels Recap
Putting an end to the daily structure of lower highs and lower lows had the potential to trigger a squeeze, a scenario that ultimately played out today. The session formed a P-shaped profile, reflecting short covering.
The key now is whether new buyers step in to build on this move, or whether it becomes an opportunity for stronger sellers to step in. Monitor the composite distribution, as we closed at its upper end.
Intraday strength would be indicated by a reclaim of 7479 (UT1), while weakness would be signaled by a break and hold below 7424 (DT1), opening the door to fill the structure below the main distribution.
In terms of levels, the Smashlevel is 7452, where notable order flow activity took place. Holding below 7452 would target the afternoon pullback low at 7424 (DT1), with a final downside target at 7390 (FDT) under sustained selling pressure.
On the flip side, reclaiming and holding above 7452 would shift focus to the unfilled gap at 7479 (UT1), with a final upside target at 7509 (FUT) under sustained buying pressure.
Visual Representation
Levels of Interest
Going into tomorrow’s session, I’ll closely observe the behavior around 7452.
Break and hold above 7452 would target 7479 / 7509
Holding below 7452 would target 7424 / 7390
Additionally, pay attention to the following VIX levels: 18.36 and 16.54. These levels can provide confirmation of strength or weakness.
Break and hold above 7509 with VIX below 16.54 would confirm strength.
Break and hold below 7390 with VIX above 18.36 would confirm weakness.
Overall, it's important to exercise caution when trading outside of the highlighted yellow levels. A non-cooperative VIX may suggest possible reversals i.e trade setups.
Thanks Smash! Downside pressure at the open.
Thank you.