
ES Daily Plan | May 15, 2026
Market Context & Key Levels for the Day Ahead

— For new subscribers
The yellow levels highlighted at the bottom left of the chart are the primary intraday levels I focus on. To avoid impulsive decisions at poor trade locations, I follow a simple but effective rule: exercise caution when initiating trades outside of these yellow levels.
This means I’m cautious about chasing longs above the Final Upside Target (FUT) and shorts below the Final Downside Target (FDT). It’s important to understand that not chasing does not imply initiating a trade in the opposite direction, discipline over impulse.
Be sure to review the Weekly Plan for a broader perspective, key levels, and market expectations for the week ahead.

Contextual Analysis & Plan
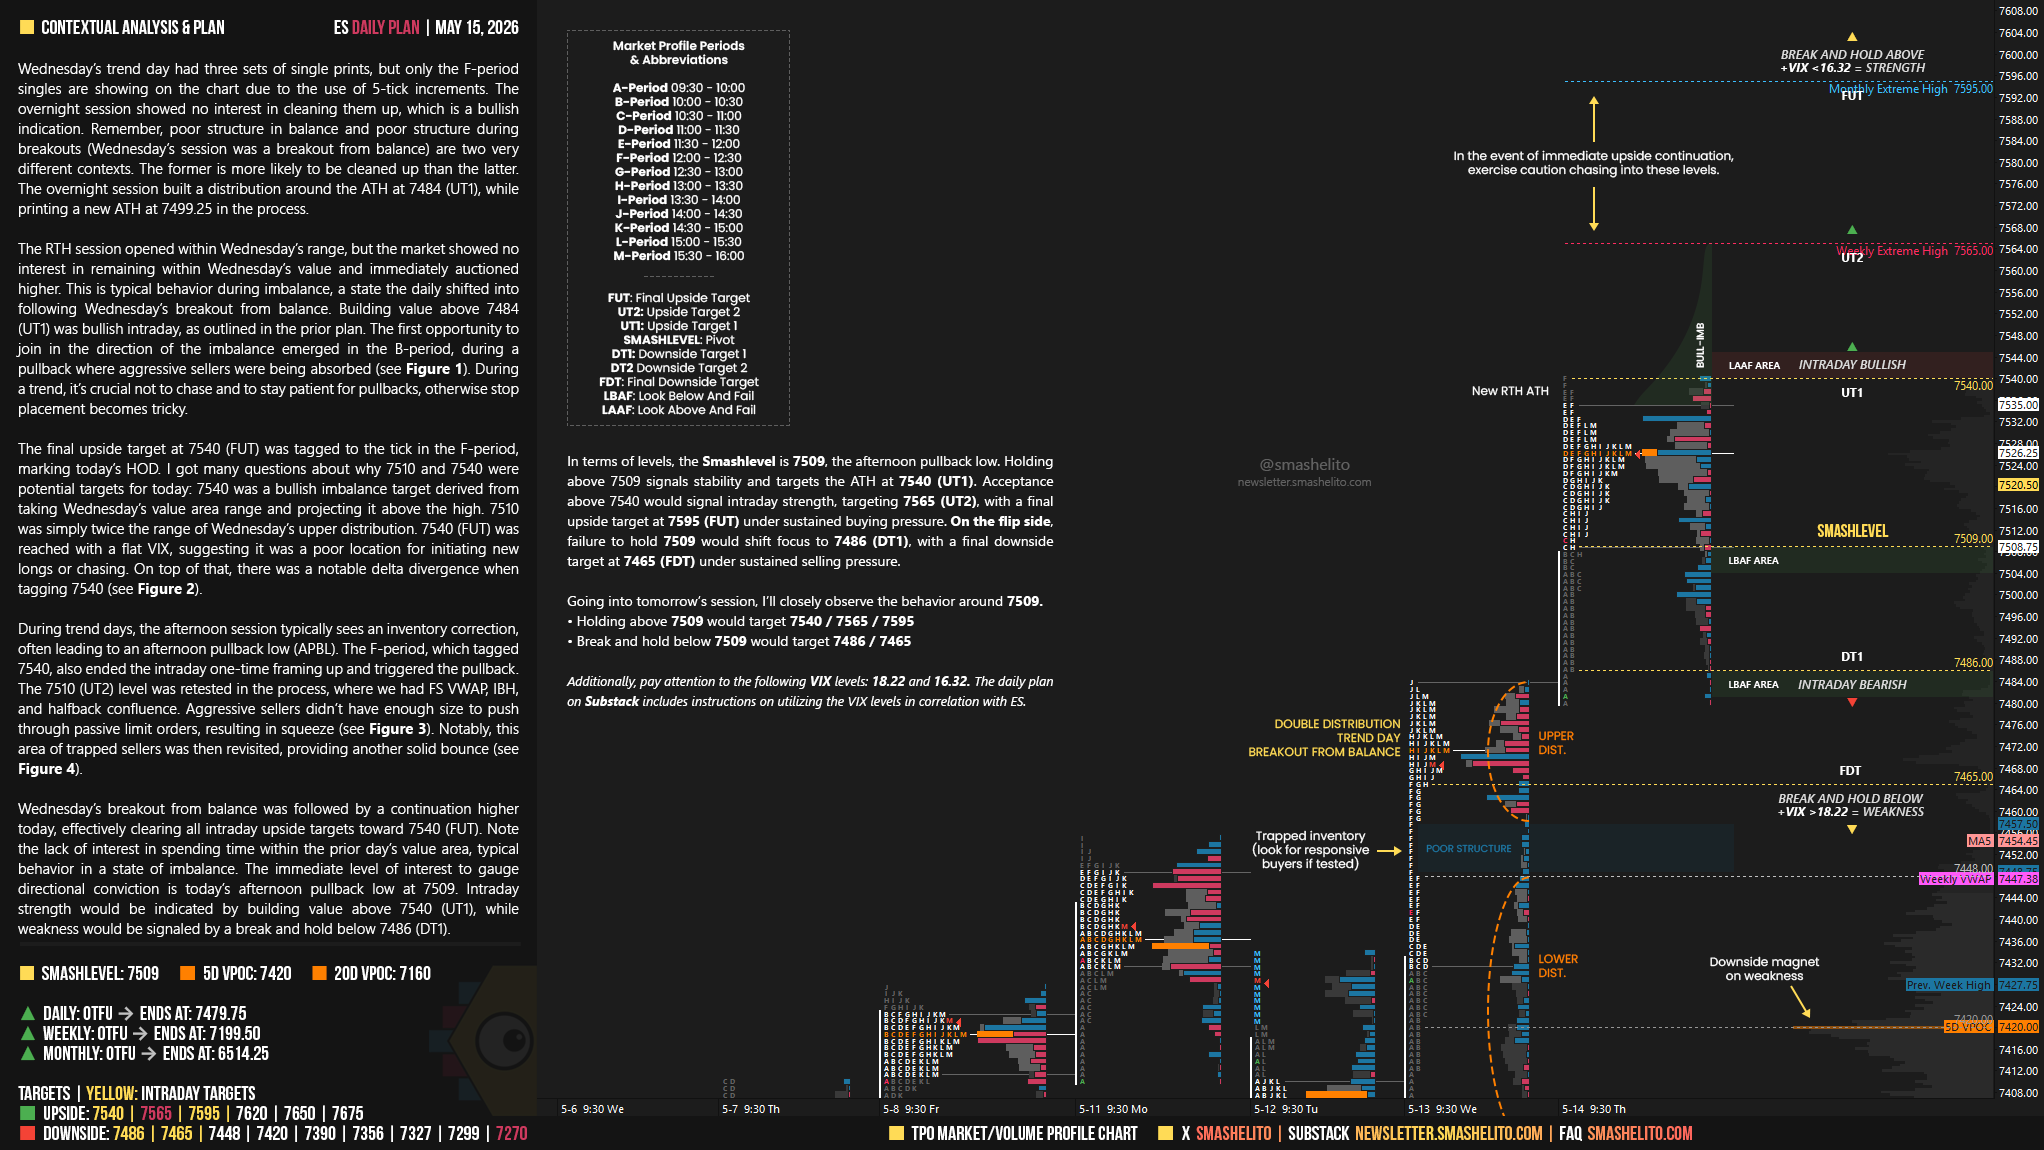
Wednesday’s trend day had three sets of single prints, but only the F-period singles are showing on the chart due to the use of 5-tick increments. The overnight session showed no interest in cleaning them up, which is a bullish indication. Remember, poor structure in balance and poor structure during breakouts (Wednesday’s session was a breakout from balance) are two very different contexts. The former is more likely to be cleaned up than the latter. The overnight session built a distribution around the ATH at 7484 (UT1), while printing a new ATH at 7499.25 in the process.
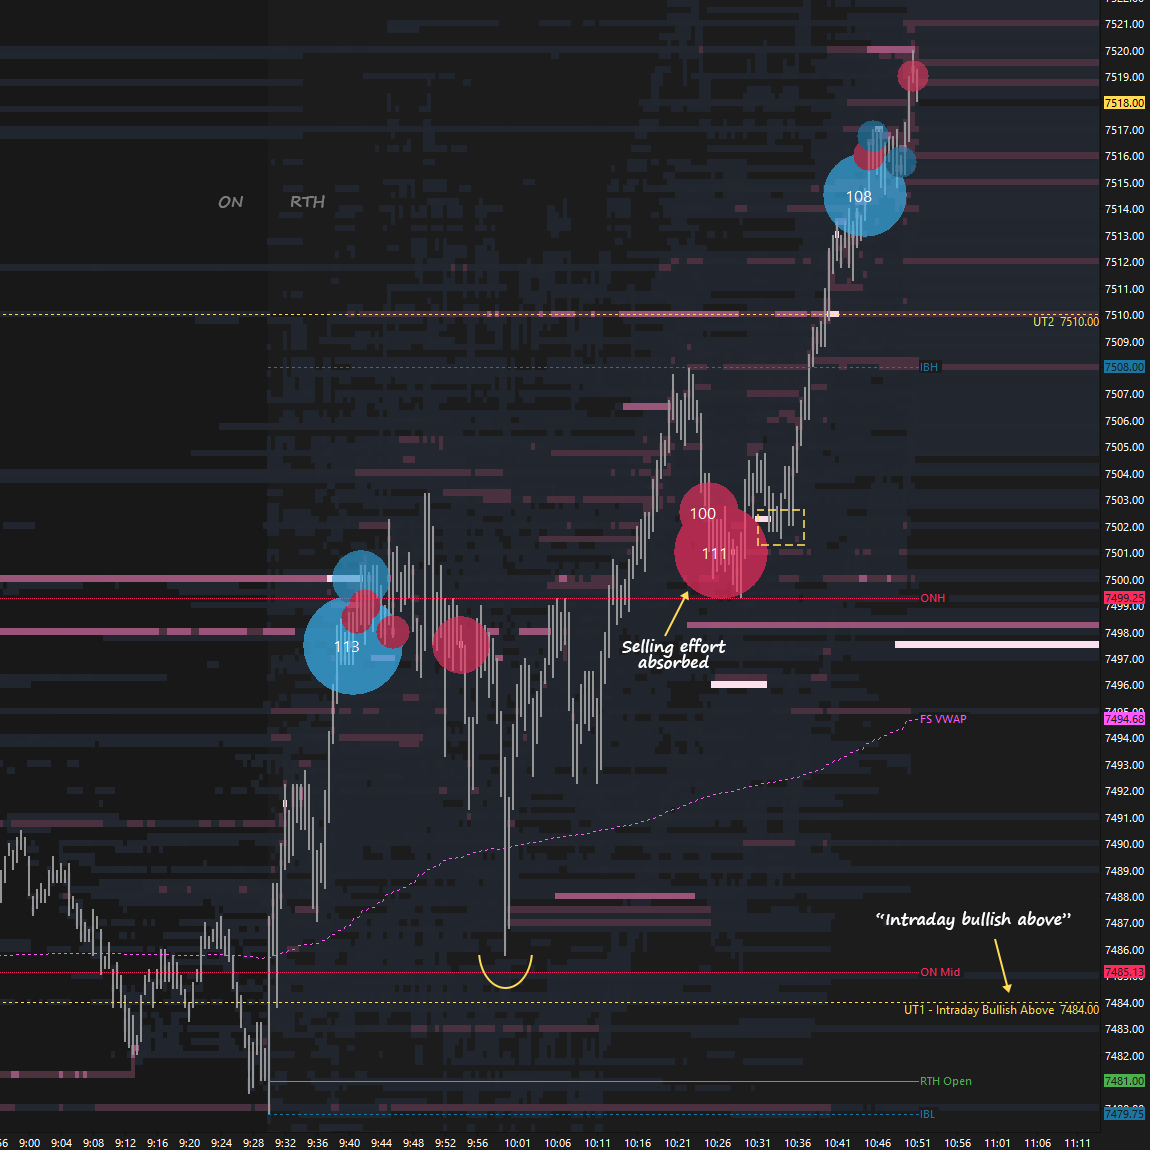
The RTH session opened within Wednesday’s range, but the market showed no interest in remaining within Wednesday’s value and immediately auctioned higher. This is typical behavior during imbalance, a state the daily shifted into following Wednesday’s breakout from balance. Building value above 7484 (UT1) was bullish intraday, as outlined in the prior plan. The first opportunity to join in the direction of the imbalance emerged in the B-period, during a pullback where aggressive sellers were being absorbed (see Figure 1). During a trend, it’s crucial not to chase and to stay patient for pullbacks, otherwise stop placement becomes tricky.
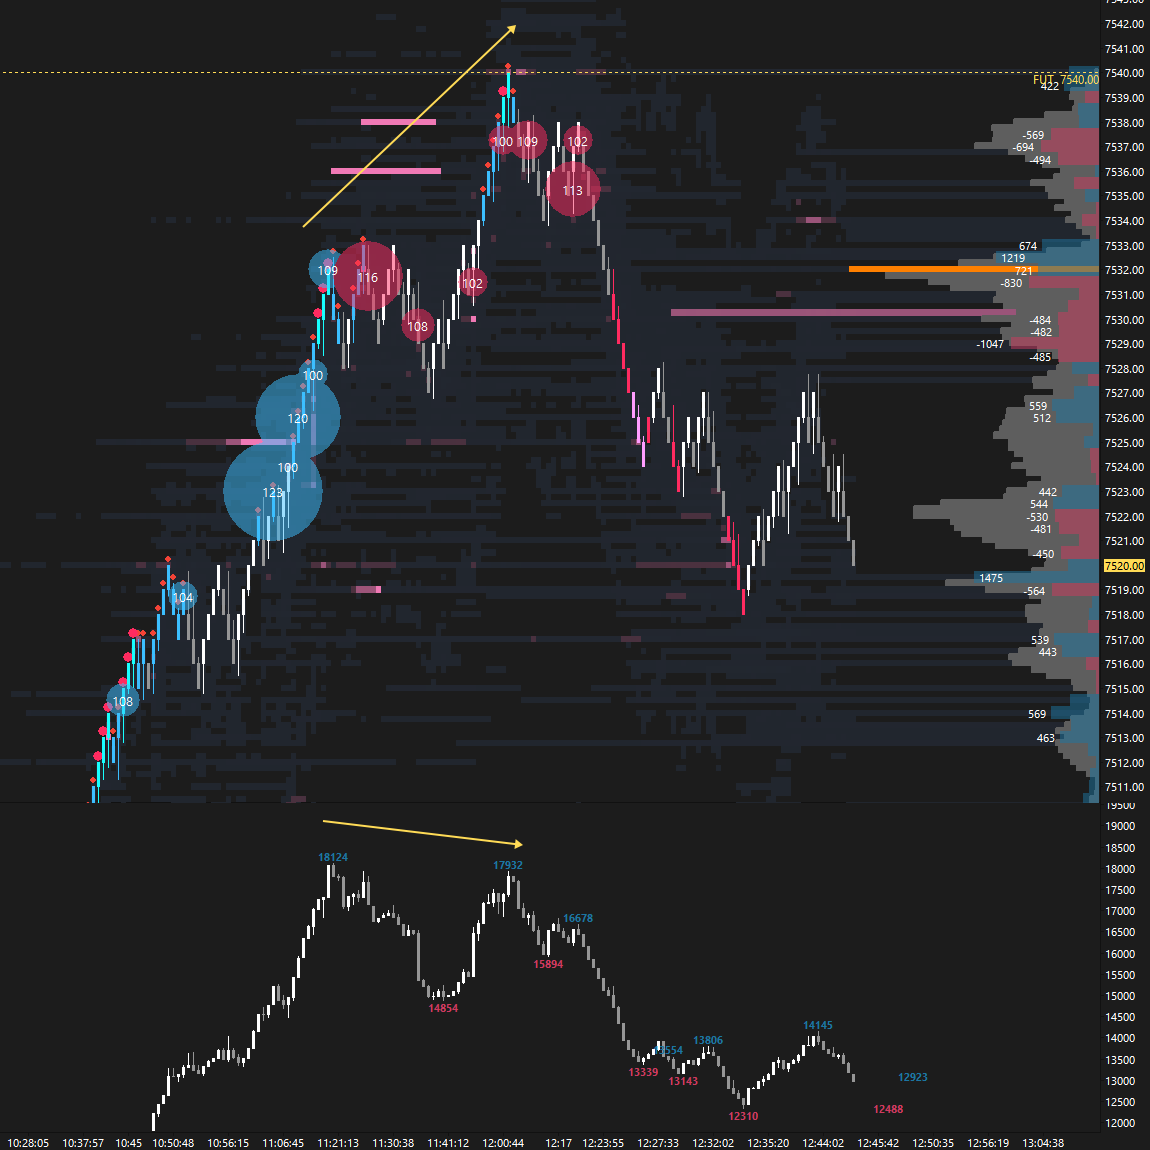
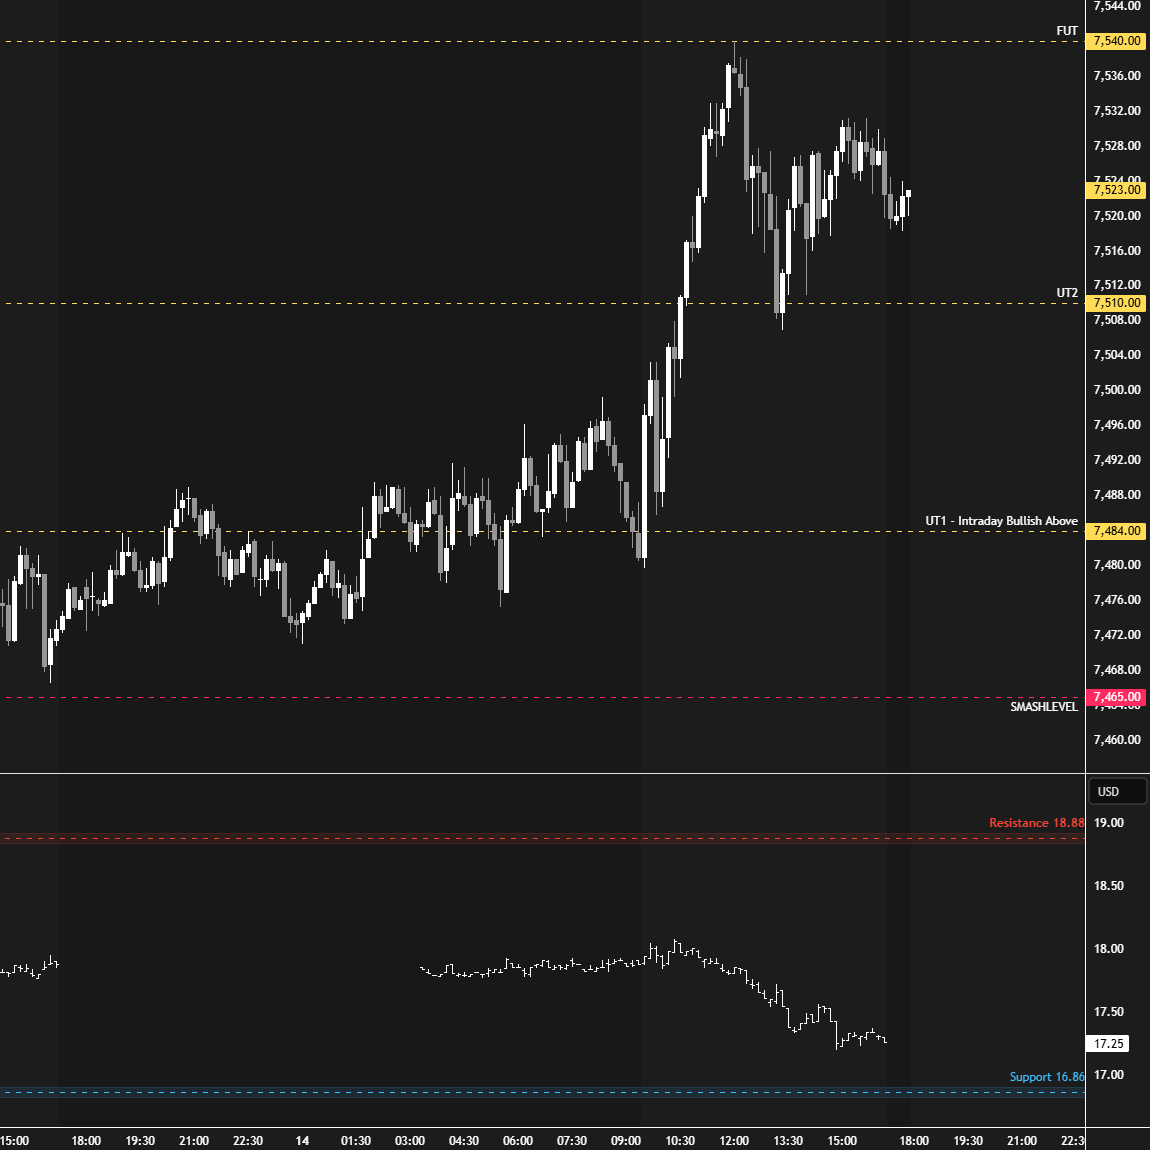
The final upside target at 7540 (FUT) was tagged to the tick in the F-period, marking today’s HOD. I got many questions about why 7510 and 7540 were potential targets for today: 7540 was a bullish imbalance target derived from taking Wednesday’s value area range and projecting it above the high. 7510 was simply twice the range of Wednesday’s upper distribution. 7540 (FUT) was reached with a flat VIX, suggesting it was a poor location for initiating new longs or chasing. On top of that, there was a notable delta divergence when tagging 7540 (see Figure 2).
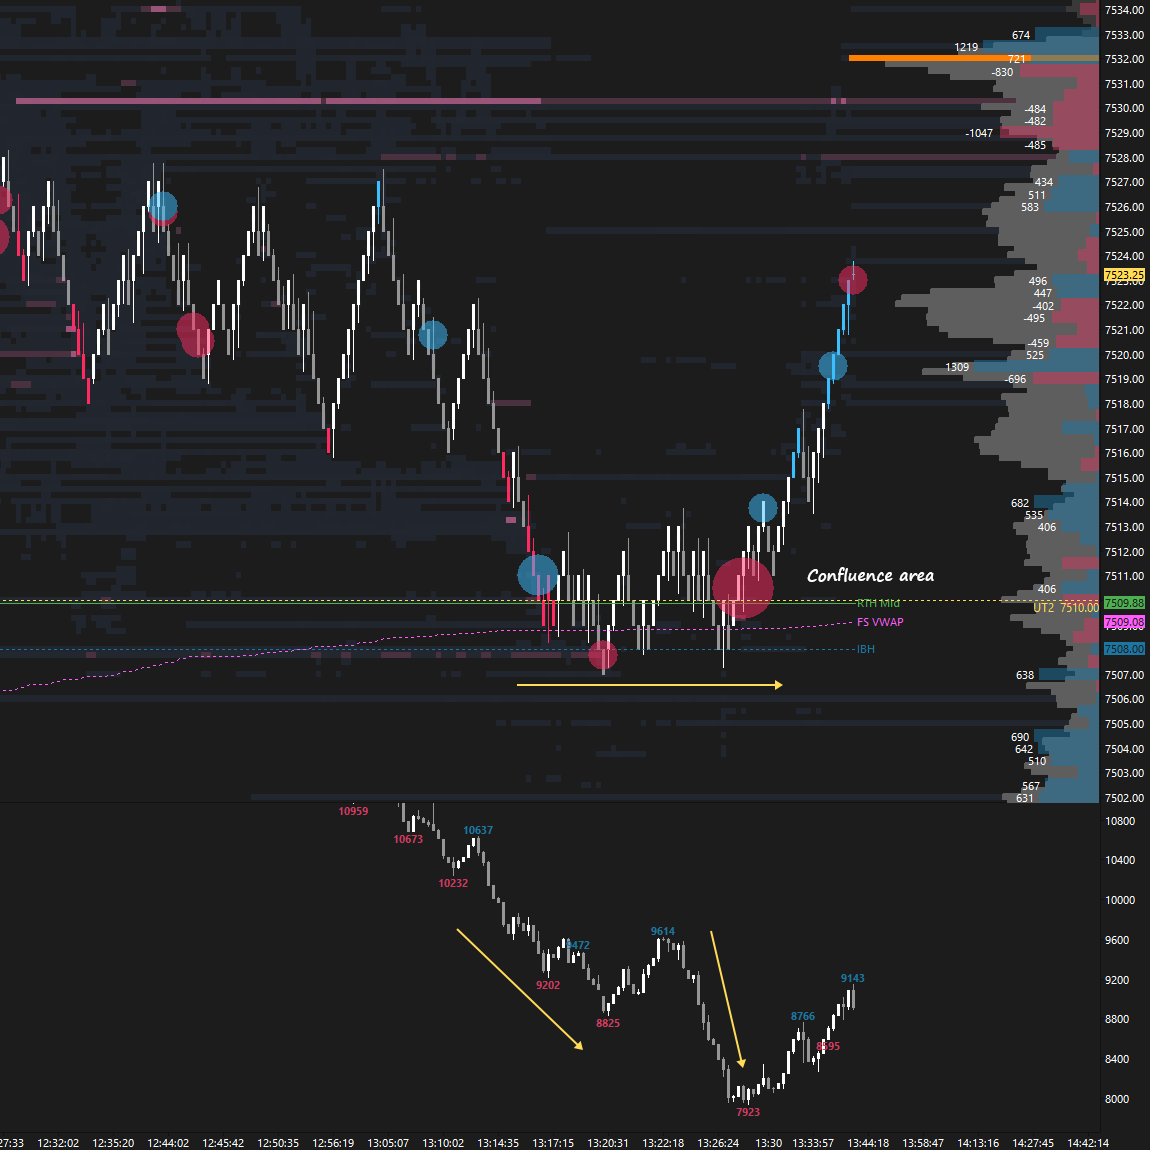
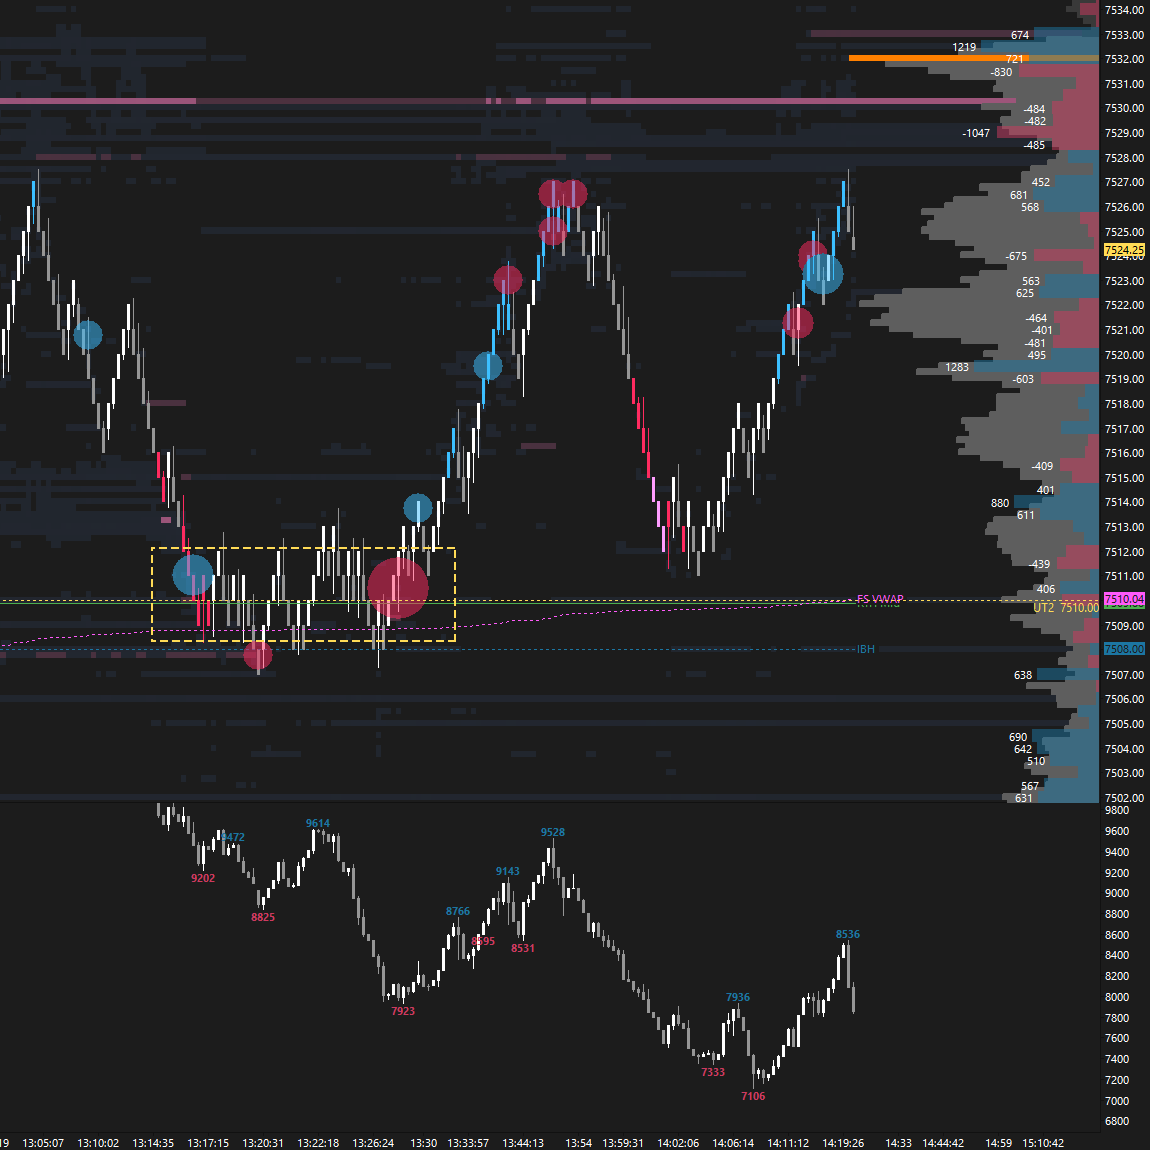
During trend days, the afternoon session typically sees an inventory correction, often leading to an afternoon pullback low (APBL). The F-period, which tagged 7540, also ended the intraday one-time framing up and triggered the pullback. The 7510 (UT2) level was retested in the process, where we had FS VWAP, IBH, and halfback confluence. Aggressive sellers didn’t have enough size to push through passive limit orders, resulting in squeeze (see Figure 3). Notably, this area of trapped sellers was then revisited, providing another solid bounce (see Figure 4).
Smashlevels Recap
Wednesday’s breakout from balance was followed by a continuation higher today, effectively clearing all intraday upside targets toward 7540 (FUT). Note the lack of interest in spending time within the prior day’s value area, typical behavior in a state of imbalance.
The immediate level of interest to gauge directional conviction is today’s afternoon pullback low at 7509. Intraday strength would be indicated by building value above 7540 (UT1), while weakness would be signaled by a break and hold below 7486 (DT1).
In terms of levels, the Smashlevel is 7509, the afternoon pullback low. Holding above 7509 signals stability and targets the ATH at 7540 (UT1). Acceptance above 7540 would signal intraday strength, targeting 7565 (UT2), with a final upside target at 7595 (FUT) under sustained buying pressure.
On the flip side, failure to hold 7509 would shift focus to 7486 (DT1), with a final downside target at 7465 (FDT) under sustained selling pressure.
Visual Representation
Levels of Interest
Going into tomorrow’s session, I’ll closely observe the behavior around 7509.
Holding above 7509 would target 7540 / 7565 / 7595
Break and hold below 7509 would target 7486 / 7465
Additionally, pay attention to the following VIX levels: 18.22 and 16.32. These levels can provide confirmation of strength or weakness.
Break and hold above 7595 with VIX below 16.32 would confirm strength.
Break and hold below 7465 with VIX above 18.22 would confirm weakness.
Overall, it's important to exercise caution when trading outside of the highlighted yellow levels. A non-cooperative VIX may suggest possible reversals i.e trade setups.
Great work I don’t know how you do it but that 7540 level was the perfect extension. Thank you.
Thanks for providing more and more analysis in your daily prep, really helpful in understanding how the market behaves. This is pur gold!