
ES Daily Plan | May 14, 2026
Market Context & Key Levels for the Day Ahead

— For new subscribers
The yellow levels highlighted at the bottom left of the chart are the primary intraday levels I focus on. To avoid impulsive decisions at poor trade locations, I follow a simple but effective rule: exercise caution when initiating trades outside of these yellow levels.
This means I’m cautious about chasing longs above the Final Upside Target (FUT) and shorts below the Final Downside Target (FDT). It’s important to understand that not chasing does not imply initiating a trade in the opposite direction, discipline over impulse.
Be sure to review the Weekly Plan for a broader perspective, key levels, and market expectations for the week ahead.

Contextual Analysis & Plan
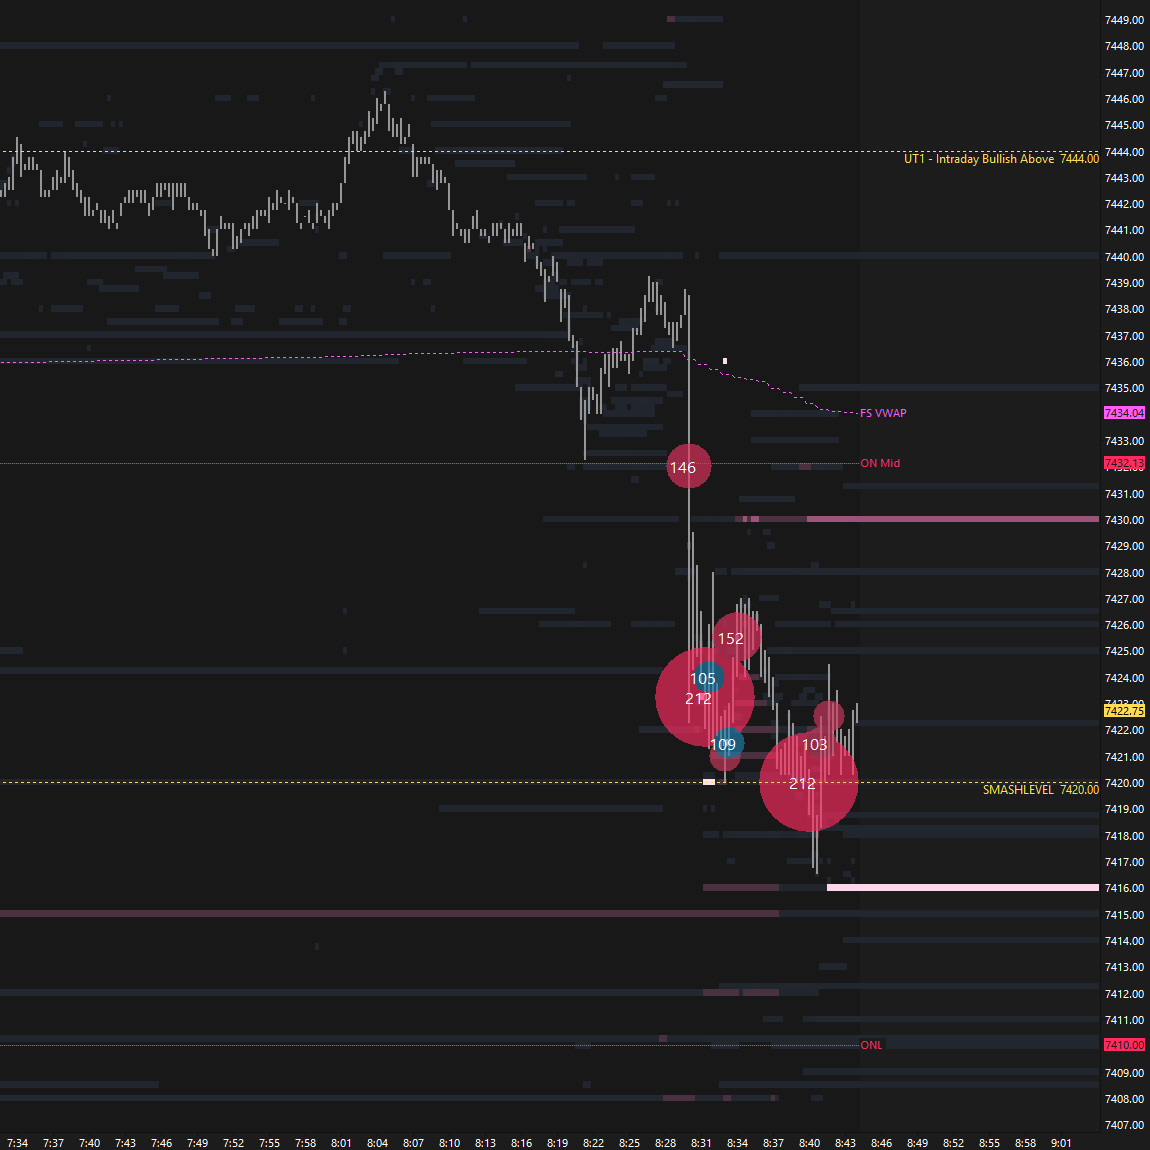
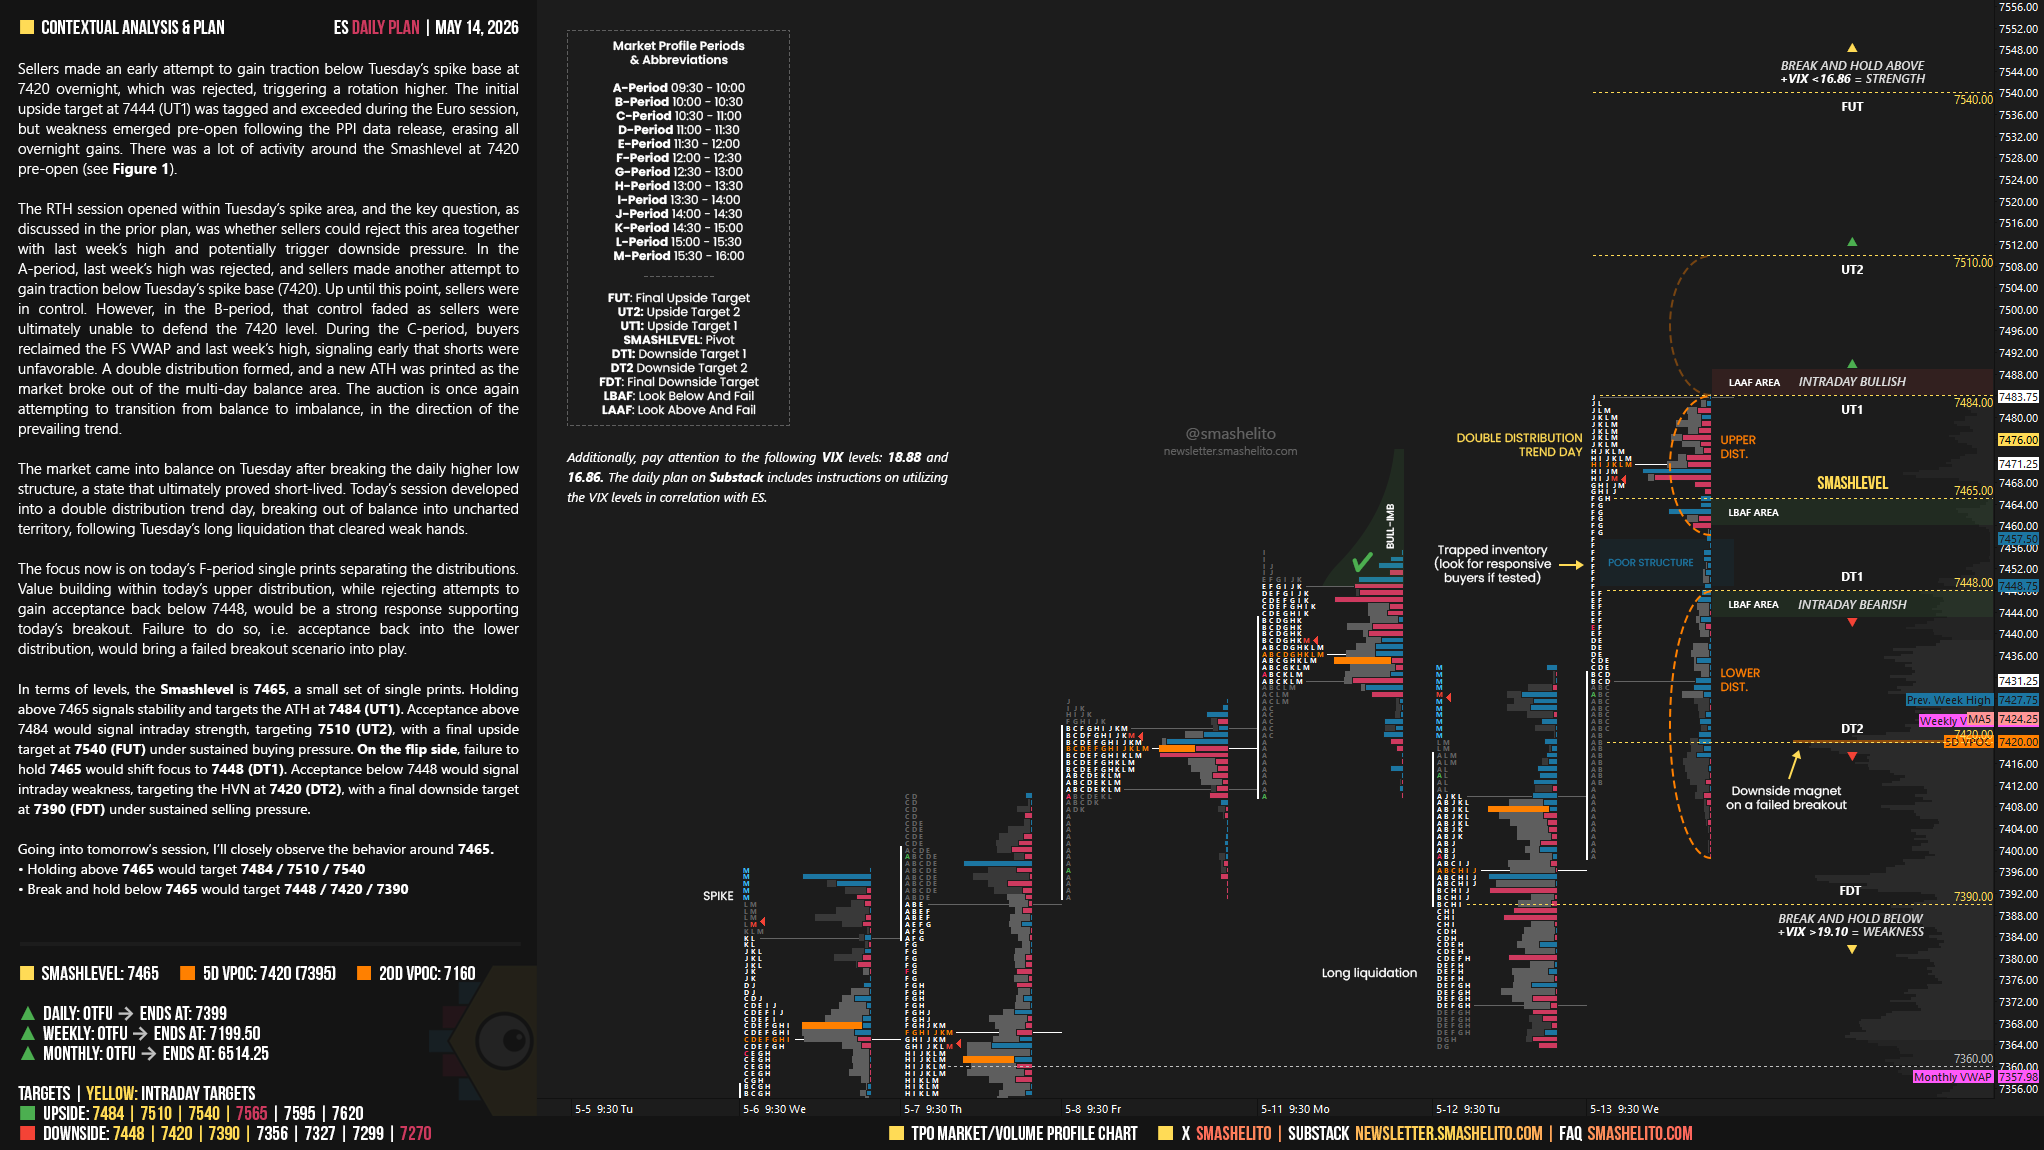
Sellers made an early attempt to gain traction below Tuesday’s spike base at 7420 overnight, which was rejected, triggering a rotation higher. The initial upside target at 7444 (UT1) was tagged and exceeded during the Euro session, but weakness emerged pre-open following the PPI data release, erasing all overnight gains. There was a lot of activity around the Smashlevel at 7420 pre-open (see Figure 1).
The RTH session opened within Tuesday’s spike area, and the key question, as discussed in the prior plan, was whether sellers could reject this area together with last week’s high and potentially trigger downside pressure. In the A-period, last week’s high was rejected, and sellers made another attempt to gain traction below Tuesday’s spike base (7420). Up until this point, sellers were in control. However, in the B-period, that control faded as sellers were ultimately unable to defend the 7420 level. During the C-period, buyers reclaimed the FS VWAP and last week’s high, signaling early that shorts were unfavorable. A double distribution formed, and a new ATH was printed as the market broke out of the multi-day balance area. The auction is once again attempting to transition from balance to imbalance, in the direction of the prevailing trend.
Smashlevels Recap
The market came into balance on Tuesday after breaking the daily higher low structure, a state that ultimately proved short-lived.
Today’s session developed into a double distribution trend day, breaking out of balance into uncharted territory, following Tuesday’s long liquidation that cleared weak hands.
The focus now is on today’s F-period single prints separating the distributions. Value building within today’s upper distribution, while rejecting attempts to gain acceptance back below 7448, would be a strong response supporting today’s breakout.
Failure to do so, i.e. acceptance back into the lower distribution, would bring a failed breakout scenario into play.
In terms of levels, the Smashlevel is 7465, a small set of single prints. Holding above 7465 signals stability and targets the ATH at 7484 (UT1). Acceptance above 7484 would signal intraday strength, targeting 7510 (UT2), with a final upside target at 7540 (FUT) under sustained buying pressure.
On the flip side, failure to hold 7465 would shift focus to 7448 (DT1). Acceptance below 7448 would signal intraday weakness, targeting the HVN at 7420 (DT2), with a final downside target at 7390 (FDT) under sustained selling pressure.
Visual Representation
Levels of Interest
Going into tomorrow’s session, I’ll closely observe the behavior around 7465.
Holding above 7465 would target 7484 / 7510 / 7540
Break and hold below 7465 would target 7448 / 7420 / 7390
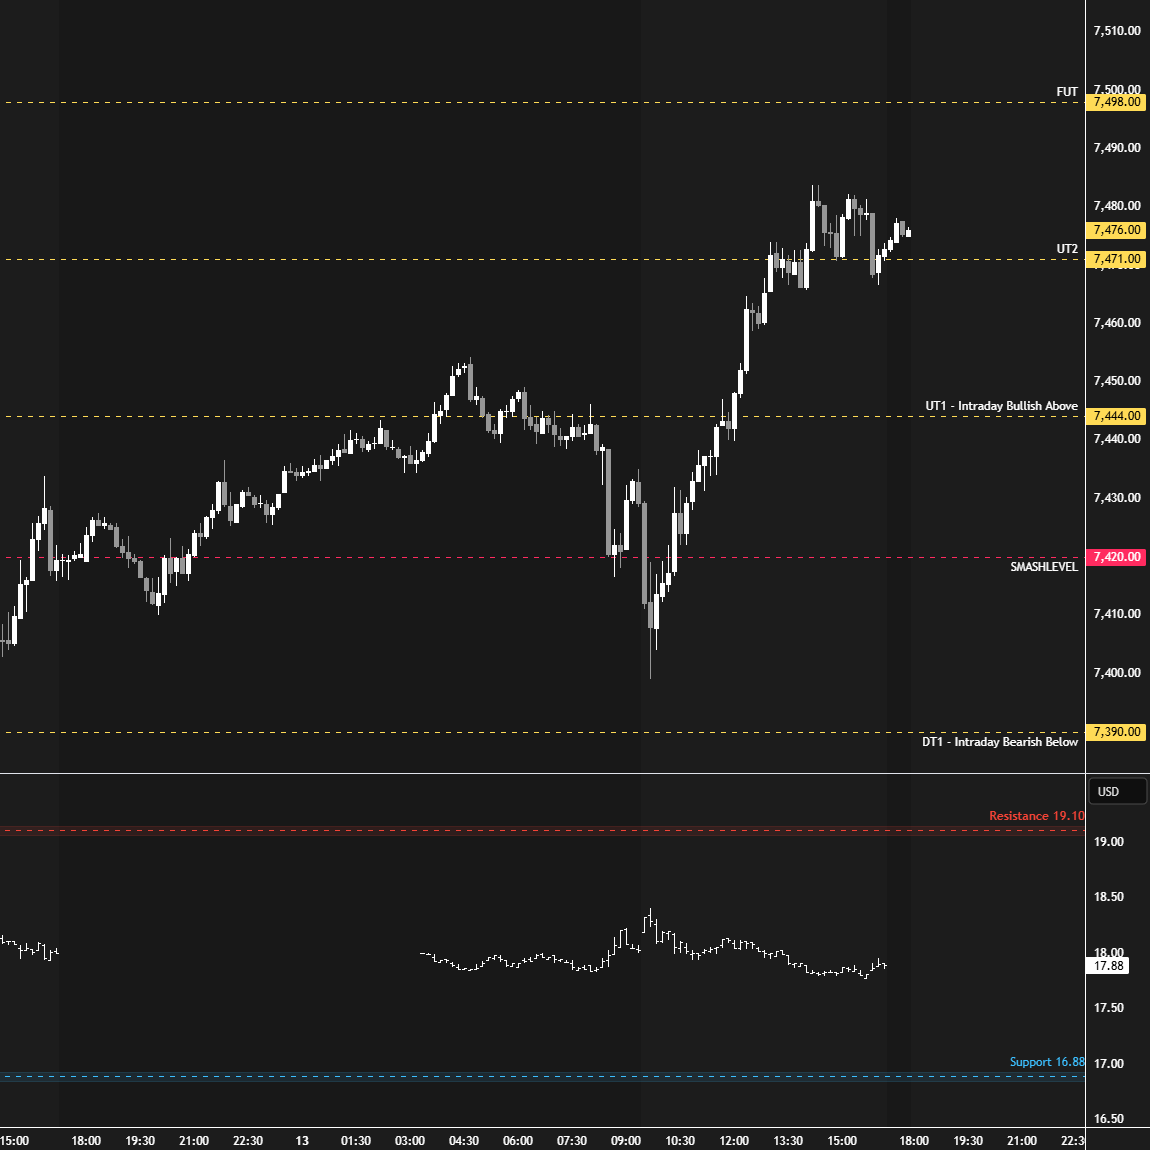
Additionally, pay attention to the following VIX levels: 18.88 and 16.86. These levels can provide confirmation of strength or weakness.
Break and hold above 7540 with VIX below 16.86 would confirm strength.
Break and hold below 7390 with VIX above 18.88 would confirm weakness.
Overall, it's important to exercise caution when trading outside of the highlighted yellow levels. A non-cooperative VIX may suggest possible reversals i.e trade setups.
Thank you Smash! Buyers can't be stopped!
Great work thank you for sharing this
You are talented and experienced
Your work is starting to help