
ES Daily Plan | May 12, 2026
Market Context & Key Levels for the Day Ahead

— For new subscribers
The yellow levels highlighted at the bottom left of the chart are the primary intraday levels I focus on. To avoid impulsive decisions at poor trade locations, I follow a simple but effective rule: exercise caution when initiating trades outside of these yellow levels.
This means I’m cautious about chasing longs above the Final Upside Target (FUT) and shorts below the Final Downside Target (FDT). It’s important to understand that not chasing does not imply initiating a trade in the opposite direction, discipline over impulse.
Be sure to review the Weekly Plan for a broader perspective, key levels, and market expectations for the week ahead.

Contextual Analysis & Plan
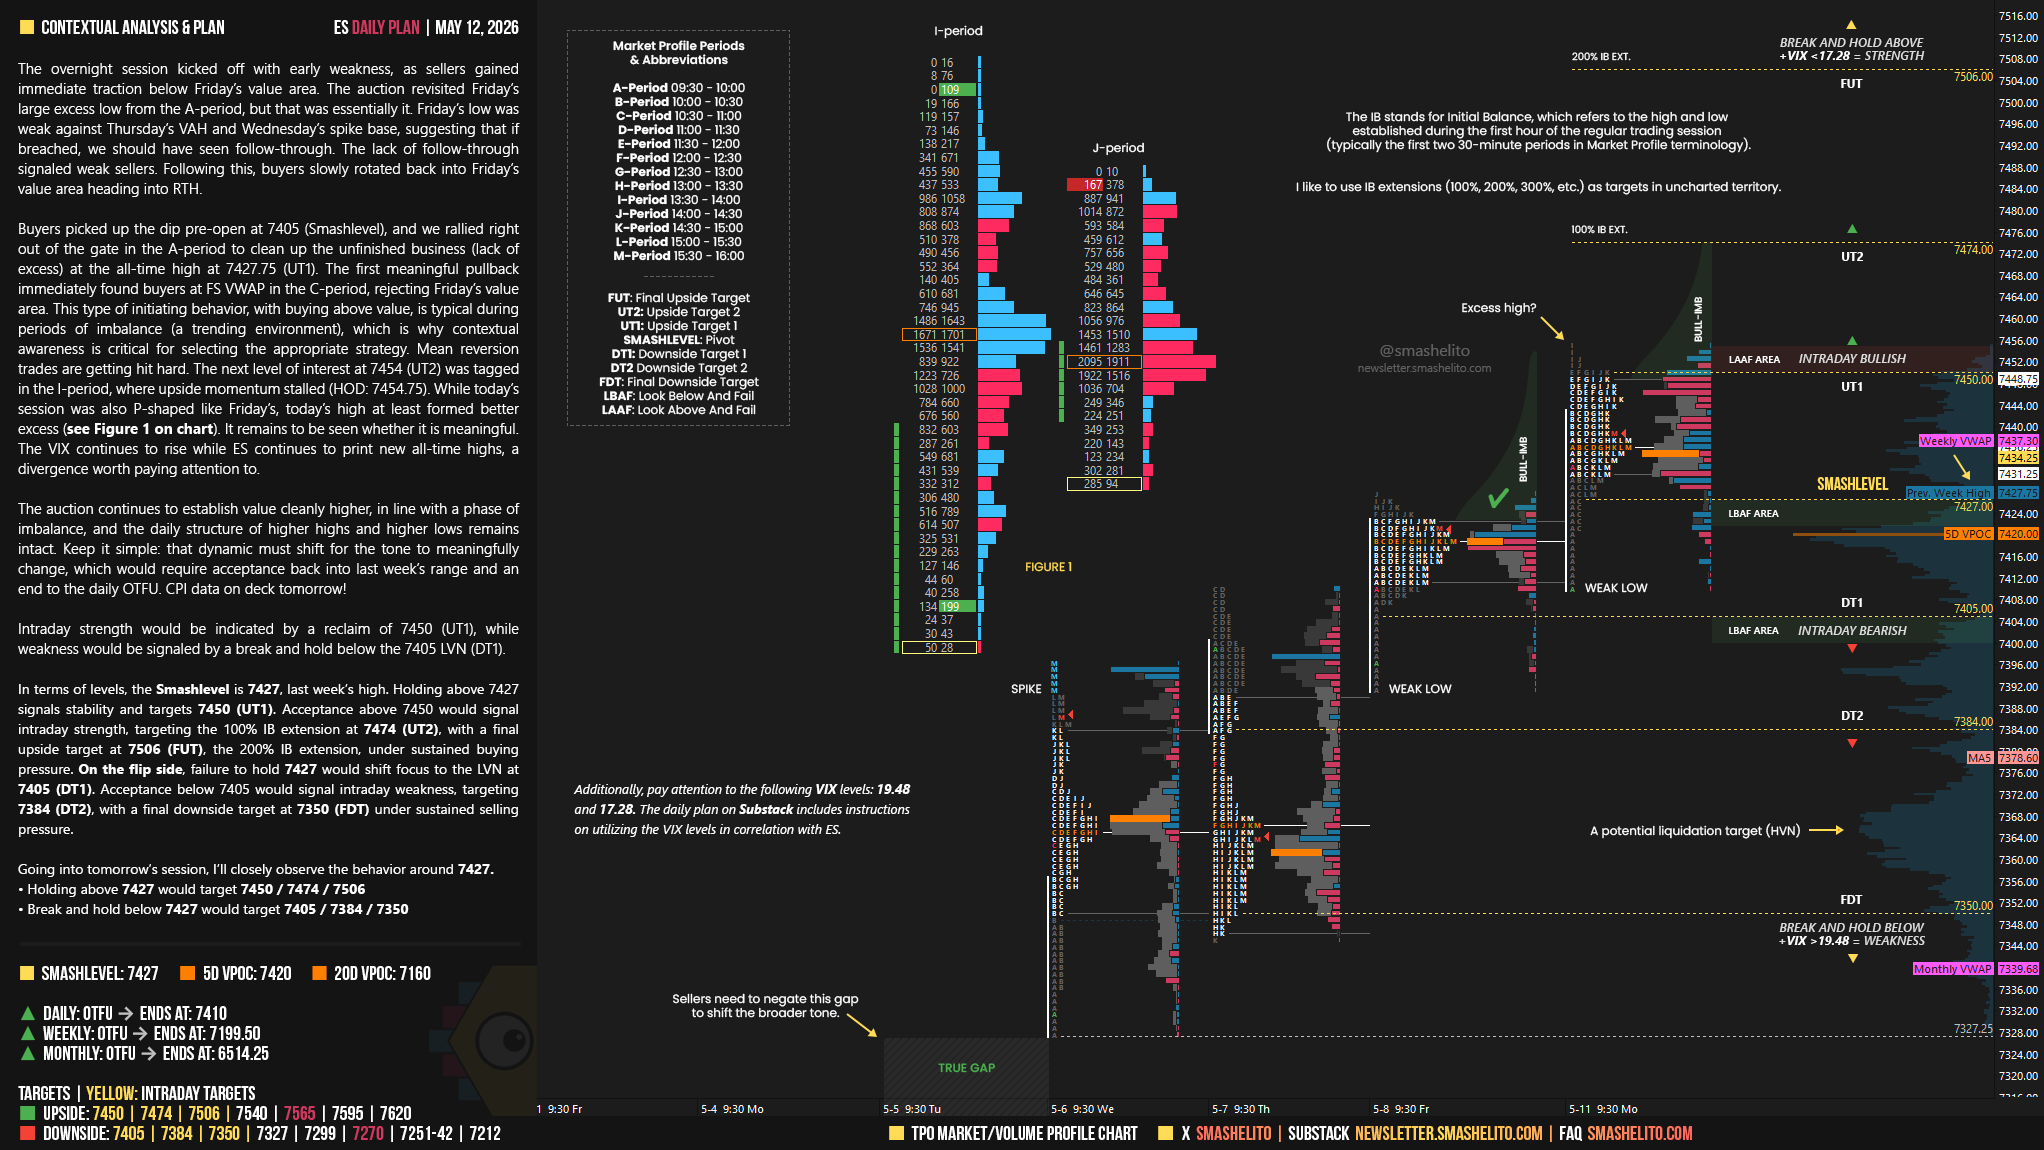
The overnight session kicked off with early weakness, as sellers gained immediate traction below Friday’s value area. The auction revisited Friday’s large excess low from the A-period, but that was essentially it. Friday’s low was weak against Thursday’s VAH and Wednesday’s spike base, suggesting that if breached, we should have seen follow-through. The lack of follow-through signaled weak sellers. Following this, buyers slowly rotated back into Friday’s value area heading into RTH.
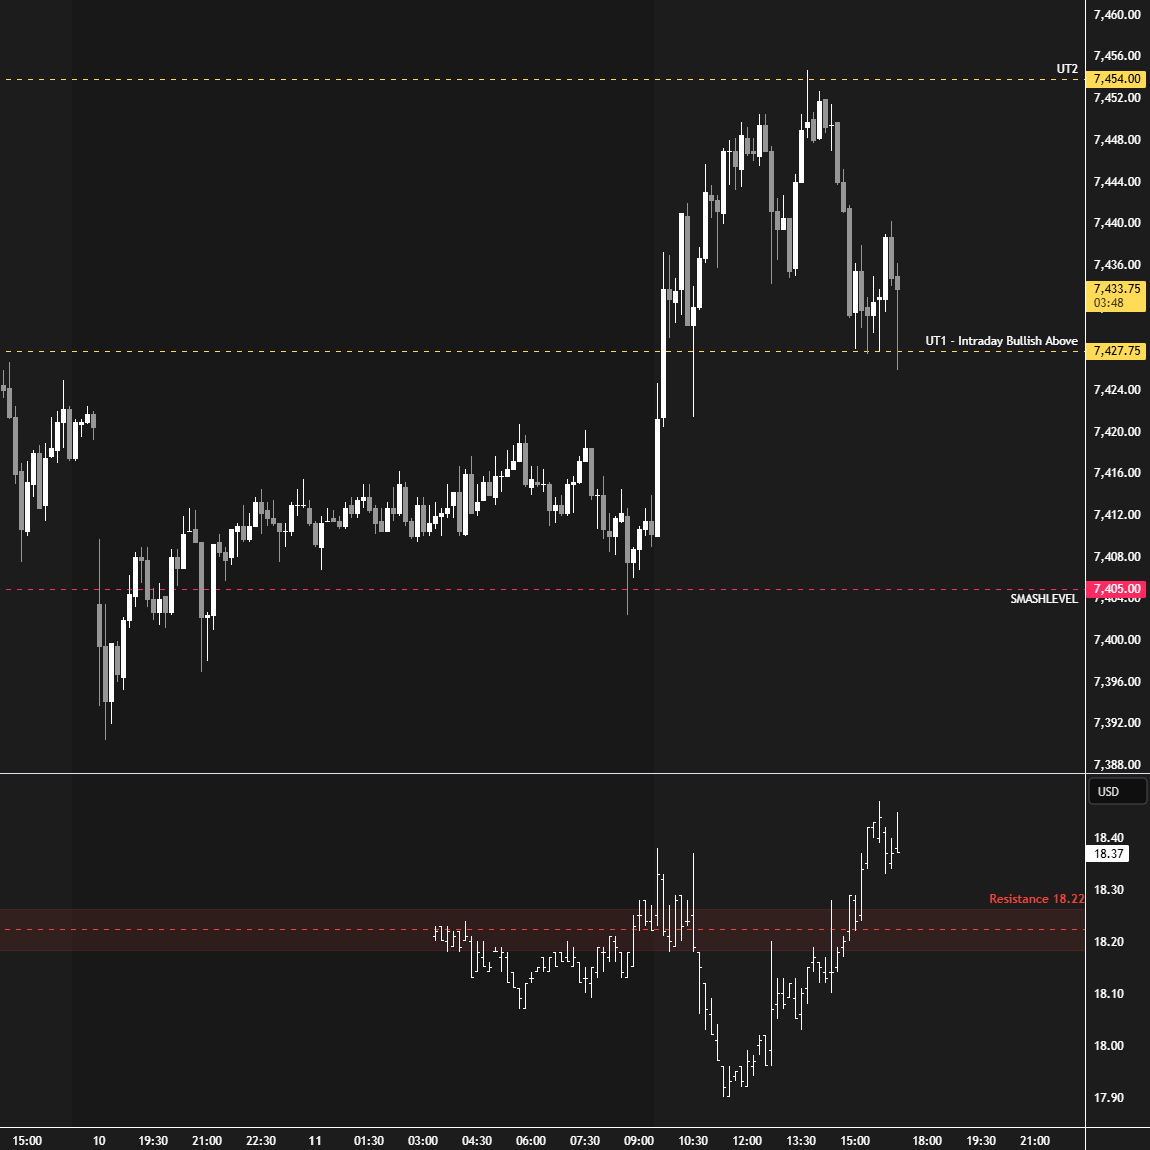
Buyers picked up the dip pre-open at 7405 (Smashlevel), and we rallied right out of the gate in the A-period to clean up the unfinished business (lack of excess) at the all-time high at 7427.75 (UT1). The first meaningful pullback immediately found buyers at FS VWAP in the C-period, rejecting Friday’s value area.
This type of initiating behavior, with buying above value, is typical during periods of imbalance (a trending environment), which is why contextual awareness is critical for selecting the appropriate strategy. Mean reversion trades are getting hit hard. The next level of interest at 7454 (UT2) was tagged in the I-period, where upside momentum stalled (HOD: 7454.75). While today’s session was also P-shaped like Friday’s, today’s high at least formed better excess (see Figure 1 on chart). It remains to be seen whether it is meaningful. The VIX continues to rise while ES continues to print new all-time highs, a divergence worth paying attention to.
Smashlevels Recap
The auction continues to establish value cleanly higher, in line with a phase of imbalance, while the daily structure of higher highs and higher lows remains intact.
Keep it simple: that dynamic must shift for the tone to meaningfully change, which would require acceptance back into last week’s range and an end to the daily OTFU. CPI data on deck tomorrow!
Intraday strength would be indicated by a reclaim of 7450 (UT1), while weakness would be signaled by a break and hold below the 7405 LVN (DT1).
In terms of levels, the Smashlevel is 7427, last week’s high. Holding above 7427 signals stability and targets 7450 (UT1). Acceptance above 7450 would signal intraday strength, targeting the 100% IB extension at 7474 (UT2), with a final upside target at 7506 (FUT), the 200% IB extension, under sustained buying pressure. On the flip side, failure to hold 7427 would shift focus to the LVN at 7405 (DT1). Acceptance below 7405 would signal intraday weakness, targeting 7384 (DT2), with a final downside target at 7350 (FDT) under sustained selling pressure.
Visual Representation
Levels of Interest
Going into tomorrow’s session, I’ll closely observe the behavior around 7427.
Holding above 7427 would target 7450 / 7474 / 7506
Break and hold below 7427 would target 7405 / 7384 / 7350
Additionally, pay attention to the following VIX levels: 19.48 and 17.28. These levels can provide confirmation of strength or weakness.
Break and hold above 7506 with VIX below 17.28 would confirm strength.
Break and hold below 7350 with VIX above 19.48 would confirm weakness.
Overall, it's important to exercise caution when trading outside of the highlighted yellow levels. A non-cooperative VIX may suggest possible reversals i.e trade setups.
Excellent analysis as always, Smash! I’d add that while we’re one-time framing up, those wide POCs in both ES and NQ are the levels to watch at the open. If buyers fail to defend (and use) them and we trade below today's VAL, the trend is likely on thin ice. Losing today’s low shifts us back to balance, but in the bigger context, that might actually be healthier... it releases some of that accumulated pressure and builds a stronger base.
Great work thank you for sharing your professional experience work structure and insight it helps a lot and is helping me gain traction and professional development