
ES Daily Plan | May 1, 2026
Market Context & Key Levels for the Day Ahead

— For new subscribers
The yellow levels highlighted at the bottom left of the chart are the primary intraday levels I focus on. To avoid impulsive decisions at poor trade locations, I follow a simple but effective rule: exercise caution when initiating trades outside of these yellow levels.
This means I’m cautious about chasing longs above the Final Upside Target (FUT) and shorts below the Final Downside Target (FDT). It’s important to understand that not chasing does not imply initiating a trade in the opposite direction, discipline over impulse.
Be sure to review the Weekly Plan for a broader perspective, key levels, and market expectations for the week ahead.

Contextual Analysis & Plan
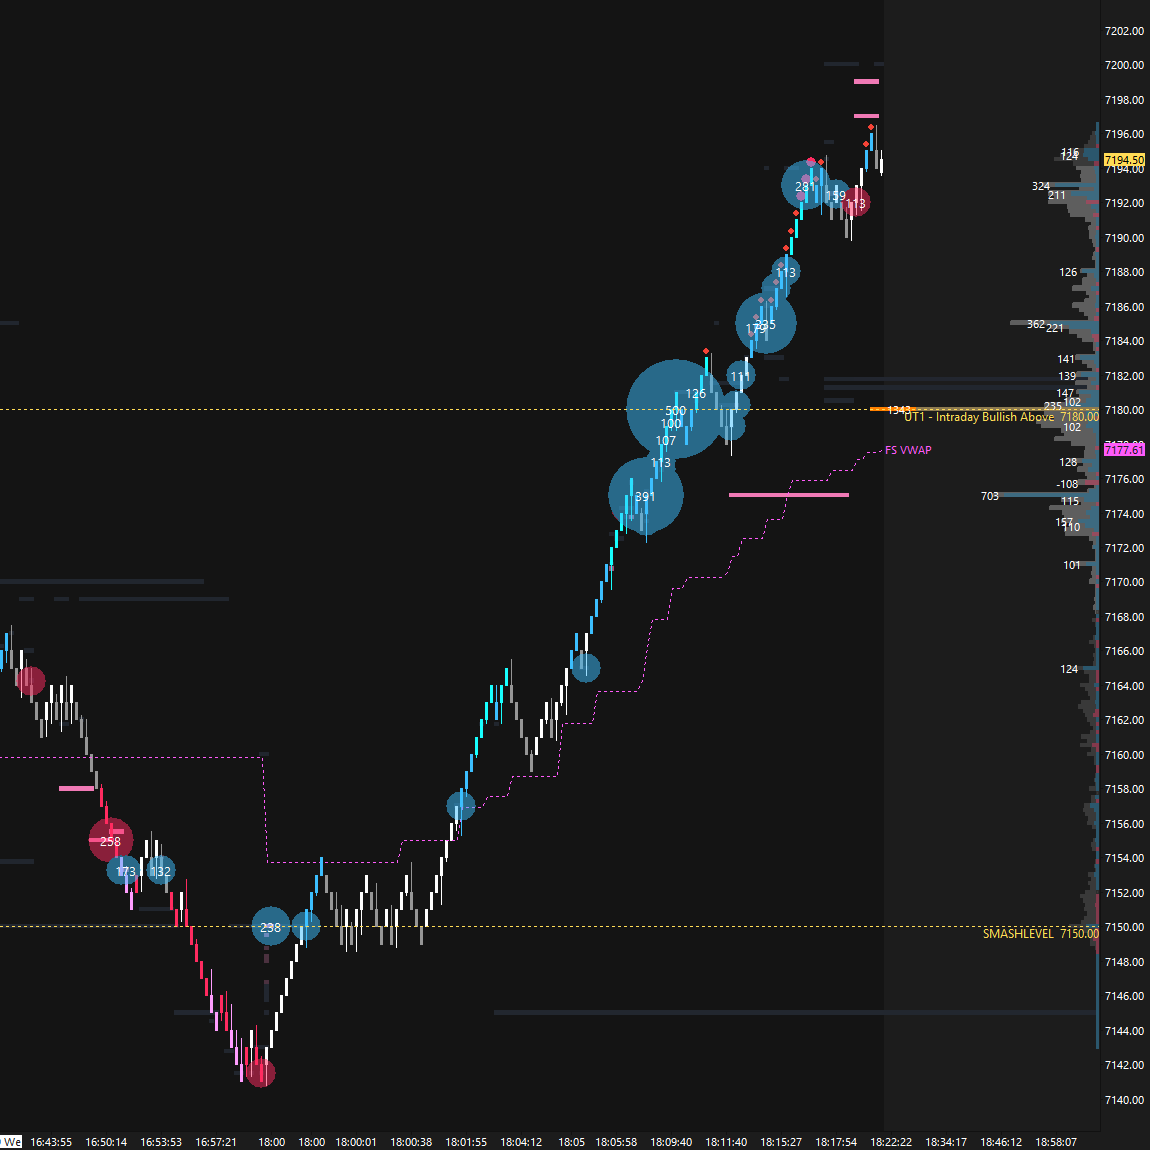
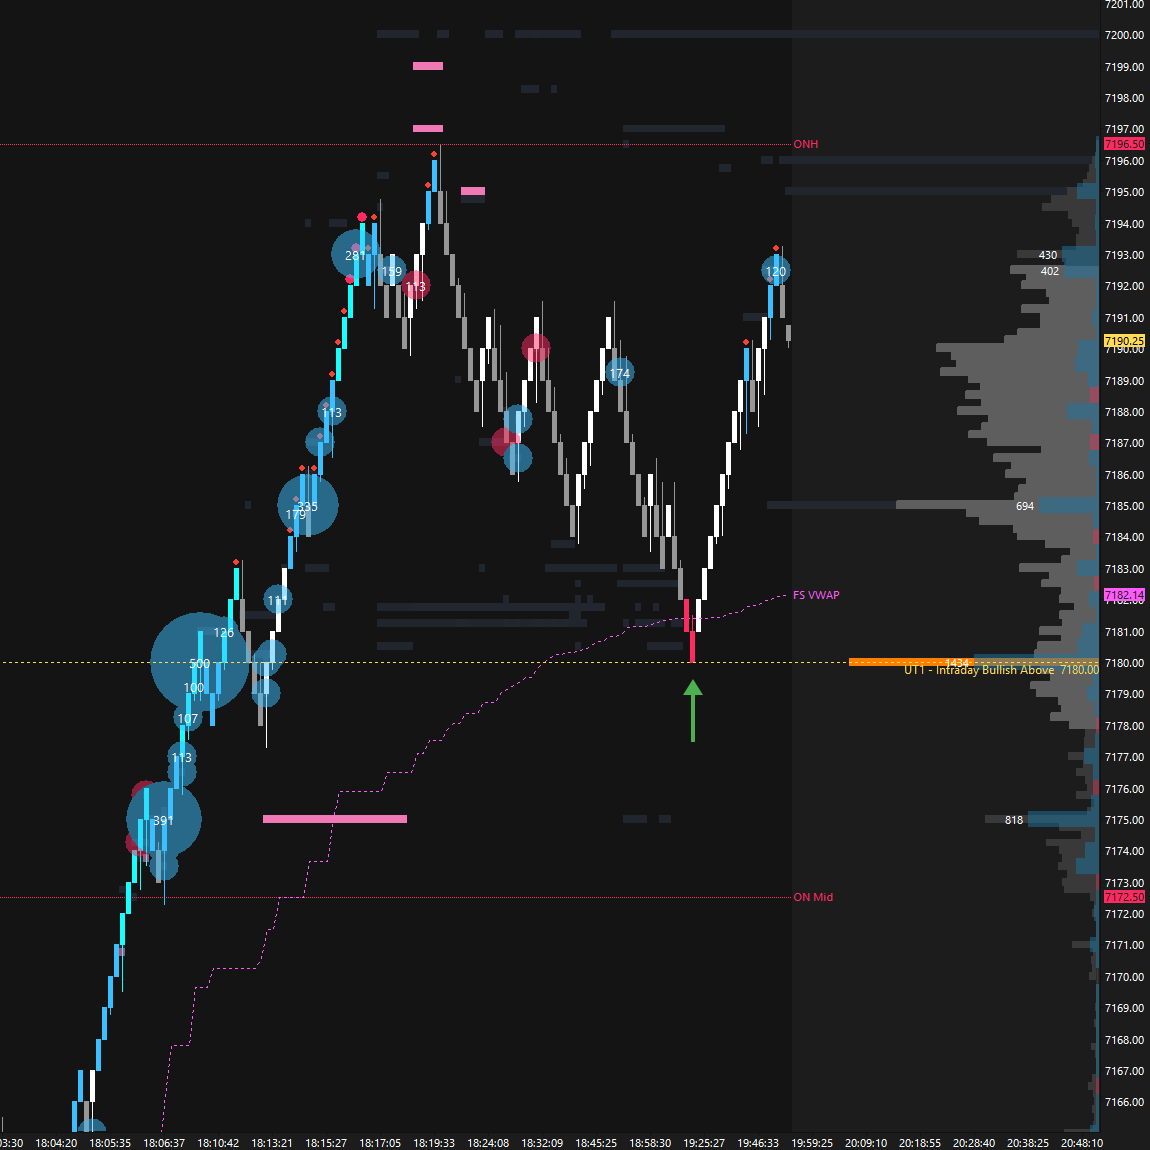
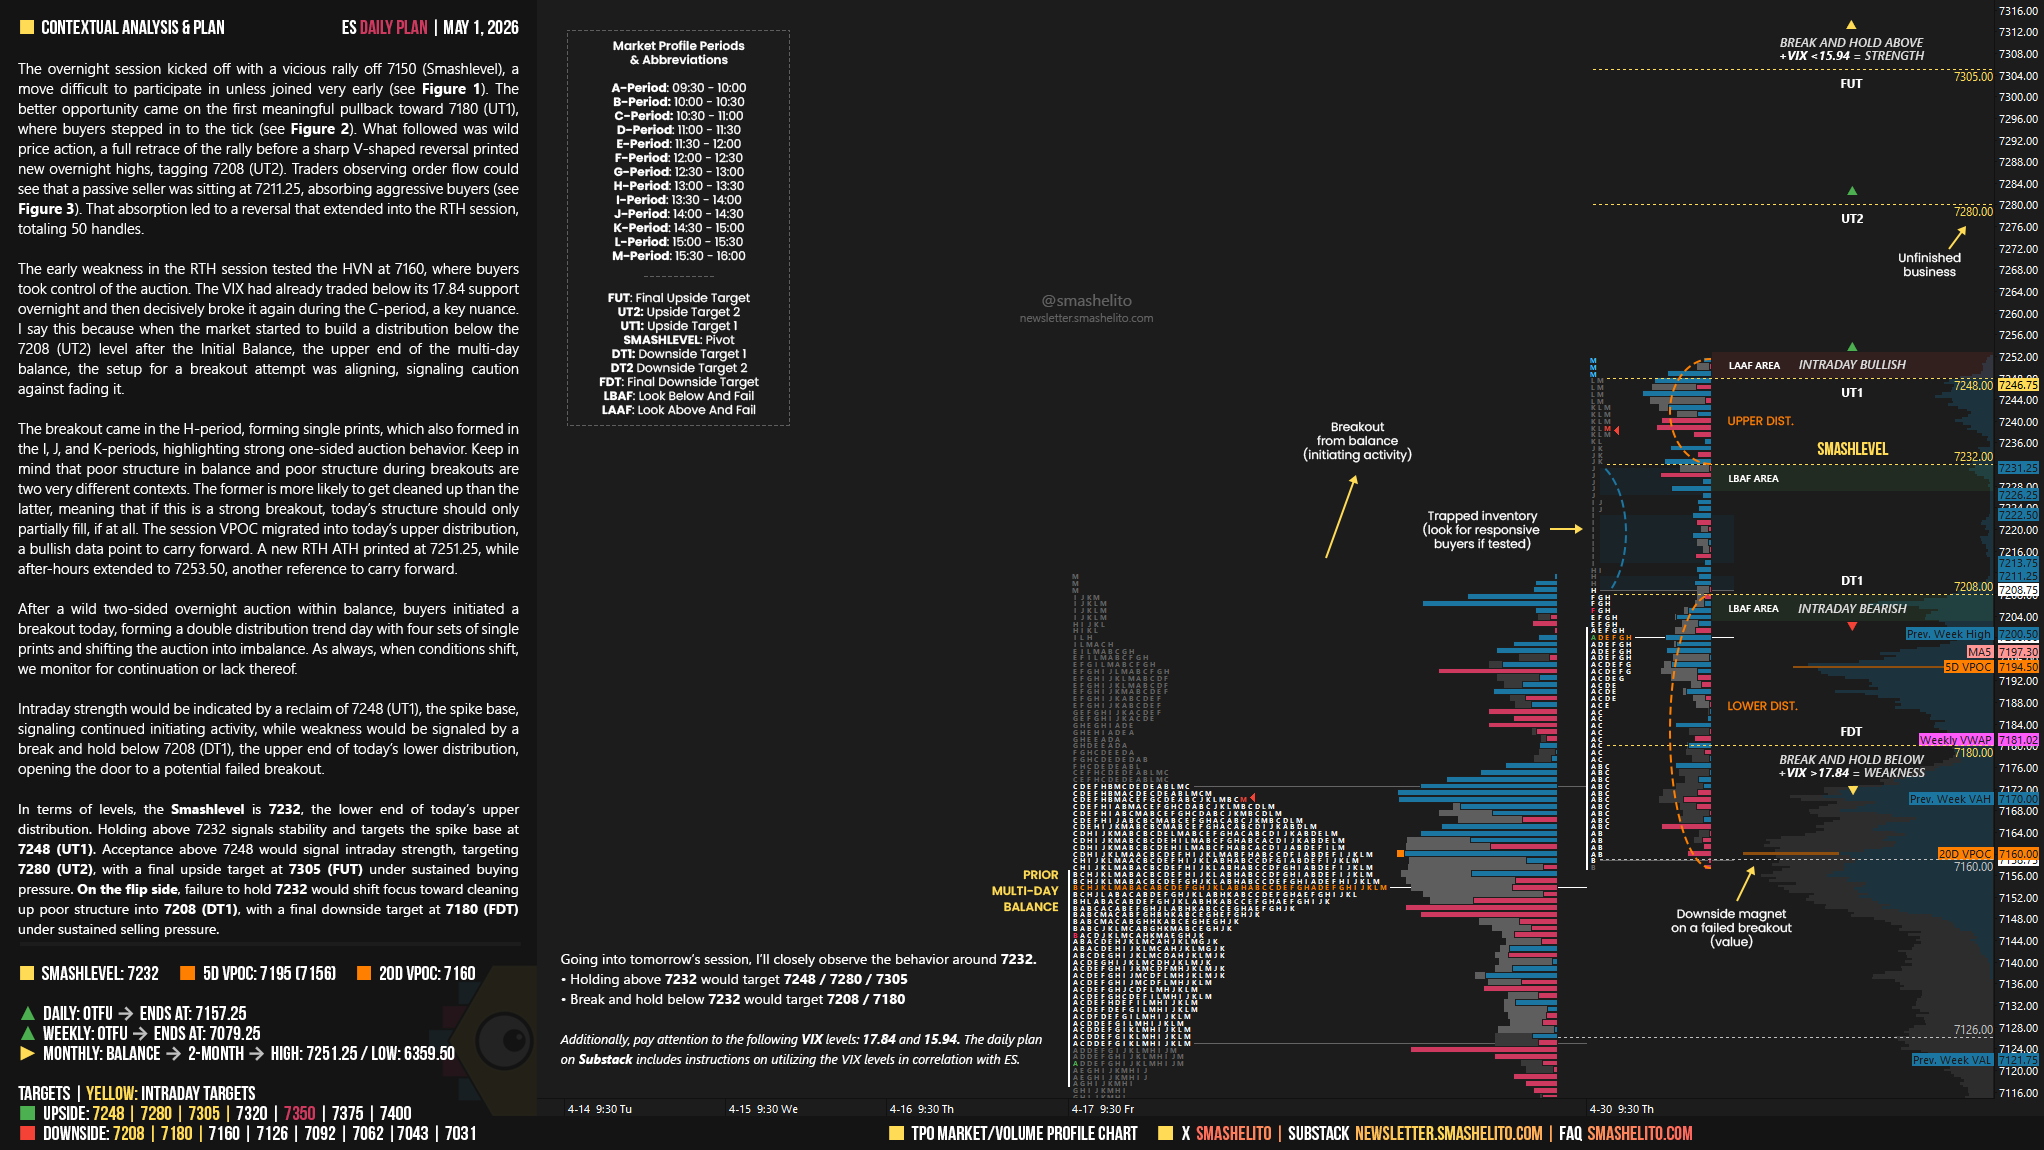
The overnight session kicked off with a vicious rally off 7150 (Smashlevel), a move difficult to participate in unless joined very early (see Figure 1). The better opportunity came on the first meaningful pullback toward 7180 (UT1), where buyers stepped in to the tick (see Figure 2).
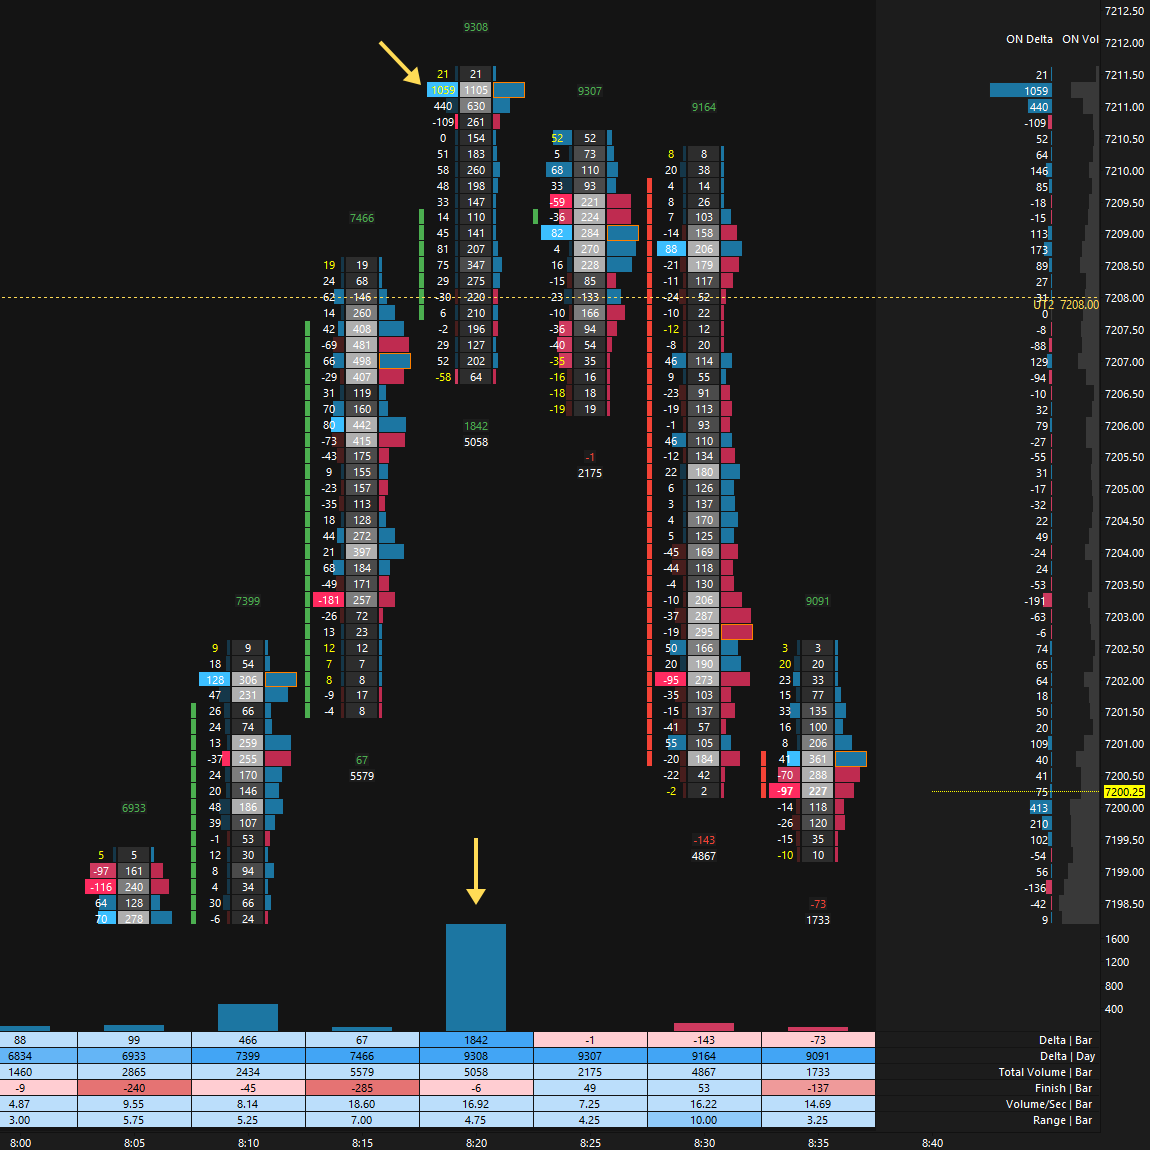
What followed was wild price action, a full retrace of the rally before a sharp V-shaped reversal printed new overnight highs, tagging 7208 (UT2). Traders observing order flow could see that a passive seller was sitting at 7211.25, absorbing aggressive buyers (see Figure 3). That absorption led to a reversal that extended into the RTH session, totaling 50 handles.
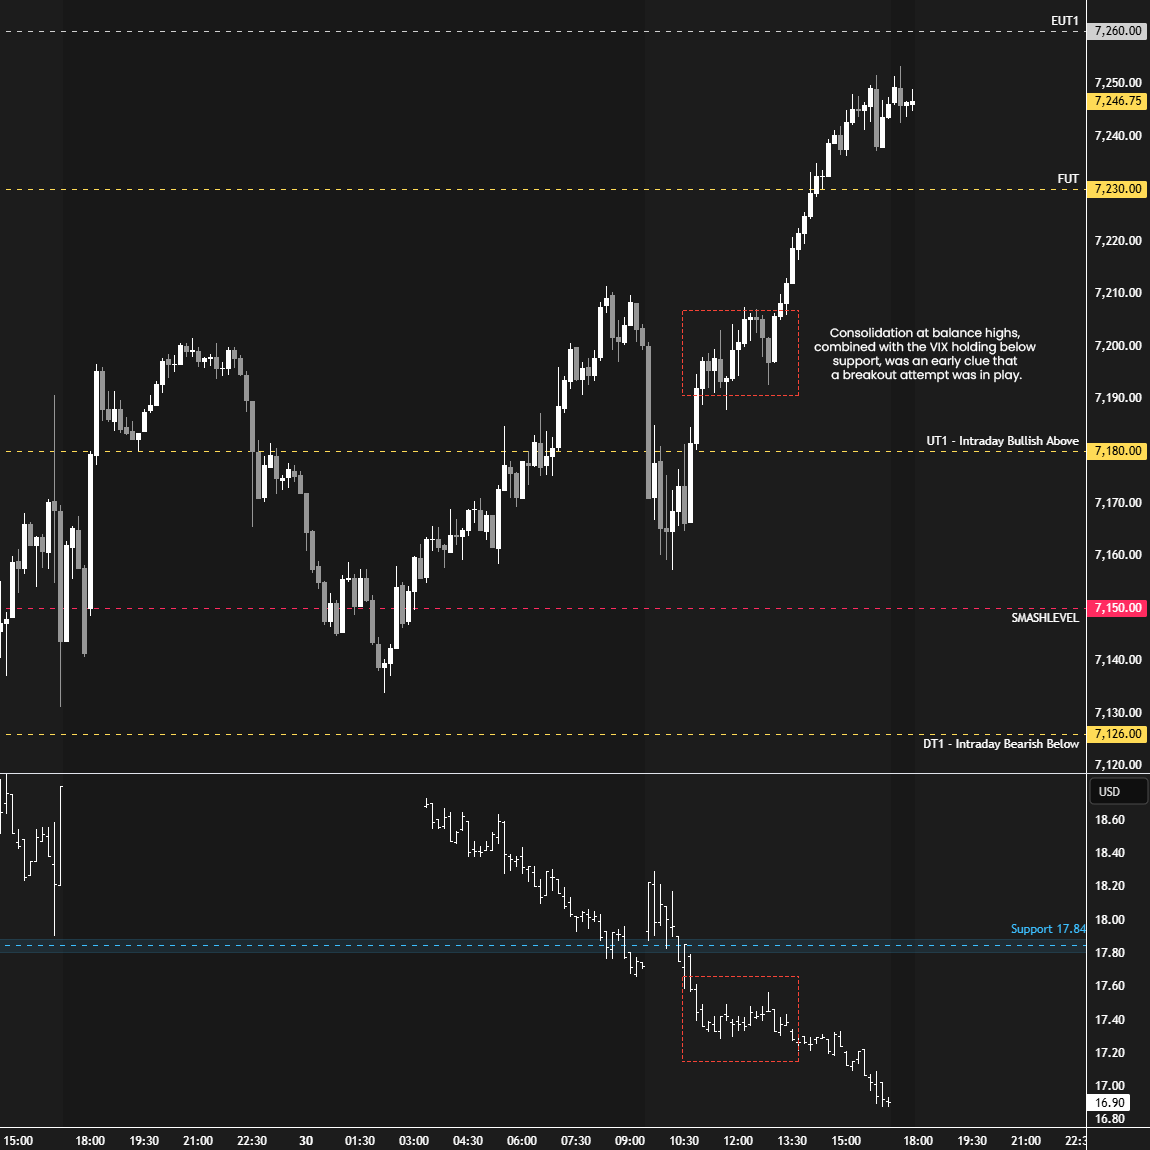
The early weakness in the RTH session tested the HVN at 7160, where buyers took control of the auction. The VIX had already traded below its 17.84 support overnight and then decisively broke it again during the C-period, a key nuance. I say this because when the market started to build a distribution below the 7208 (UT2) level after the Initial Balance, the upper end of the multi-day balance, the setup for a breakout attempt was aligning, signaling caution against fading it.
The breakout came in the H-period, forming single prints, which also formed in the I, J, and K-periods, highlighting strong one-sided auction behavior. Keep in mind that poor structure in balance and poor structure during breakouts are two very different contexts. The former is more likely to get cleaned up than the latter, meaning that if this is a strong breakout, today’s structure should only partially fill, if at all. The session VPOC migrated into today’s upper distribution, a bullish data point to carry forward. A new RTH ATH printed at 7251.25, while after-hours extended to 7253.50, another reference to carry forward.
Smashlevels Recap
After a wild two-sided overnight auction within balance, buyers initiated a breakout today, forming a double distribution trend day with four sets of single prints and shifting the auction into imbalance. As always, when conditions shift, we monitor for continuation or lack thereof.
Intraday strength would be indicated by a reclaim of 7248 (UT1), the spike base, signaling continued initiating activity, while weakness would be signaled by a break and hold below 7208 (DT1), the upper end of today’s lower distribution, opening the door to a potential failed breakout.
In terms of levels, the Smashlevel is 7232, the lower end of today’s upper distribution. Holding above 7232 signals stability and targets the spike base at 7248 (UT1). Acceptance above 7248 would signal intraday strength, targeting 7280 (UT2), with a final upside target at 7305 (FUT) under sustained buying pressure.
On the flip side, failure to hold 7232 would shift focus toward cleaning up poor structure into 7208 (DT1), with a final downside target at 7180 (FDT) under sustained selling pressure.
Visual Representation
Levels of Interest
Going into tomorrow’s session, I’ll closely observe the behavior around 7232.
Holding above 7232 would target 7248 / 7280 / 7305
Break and hold below 7232 would target 7208 / 7180
Additionally, pay attention to the following VIX levels: 17.84 and 15.94. These levels can provide confirmation of strength or weakness.
Break and hold above 7305 with VIX below 15.94 would confirm strength.
Break and hold below 7180 with VIX above 17.84 would confirm weakness.
Overall, it's important to exercise caution when trading outside of the highlighted yellow levels. A non-cooperative VIX may suggest possible reversals i.e trade setups.
Important update: Prior VIX levels were incorrect (17.10 and 15.28). The correct levels are 17.84 and 15.94. Plan has been updated accordingly.
I should get this tattooed on me, something you always say at the beginning of each newsletter: "It's important to understand that not chasing doesn't imply initiating a trade in the opposite direction; discipline over impulse."
It was a complex session for me. I only had one trade and one SL, within my usual risk strategy, but it hurt quite a bit because it took me out by two ticks before continuing the trend. It really hurts to see how my reading of the flow was correct, but perhaps I didn't give the SL the necessary size at the time.