
ES Daily Plan | March 24, 2026
Market Context & Key Levels for the Day Ahead

— For new subscribers
The yellow levels highlighted at the bottom left of the chart are the primary intraday levels I focus on. To avoid impulsive decisions at poor trade locations, I follow a simple but effective rule: exercise caution when initiating trades outside of these yellow levels.
This means I’m cautious about chasing longs above the Final Upside Target (FUT) and shorts below the Final Downside Target (FDT). It’s important to understand that not chasing does not imply initiating a trade in the opposite direction — discipline over impulse.
Be sure to review the Weekly Plan for a broader perspective, key levels, and market expectations for the week ahead.

Contextual Analysis & Plan
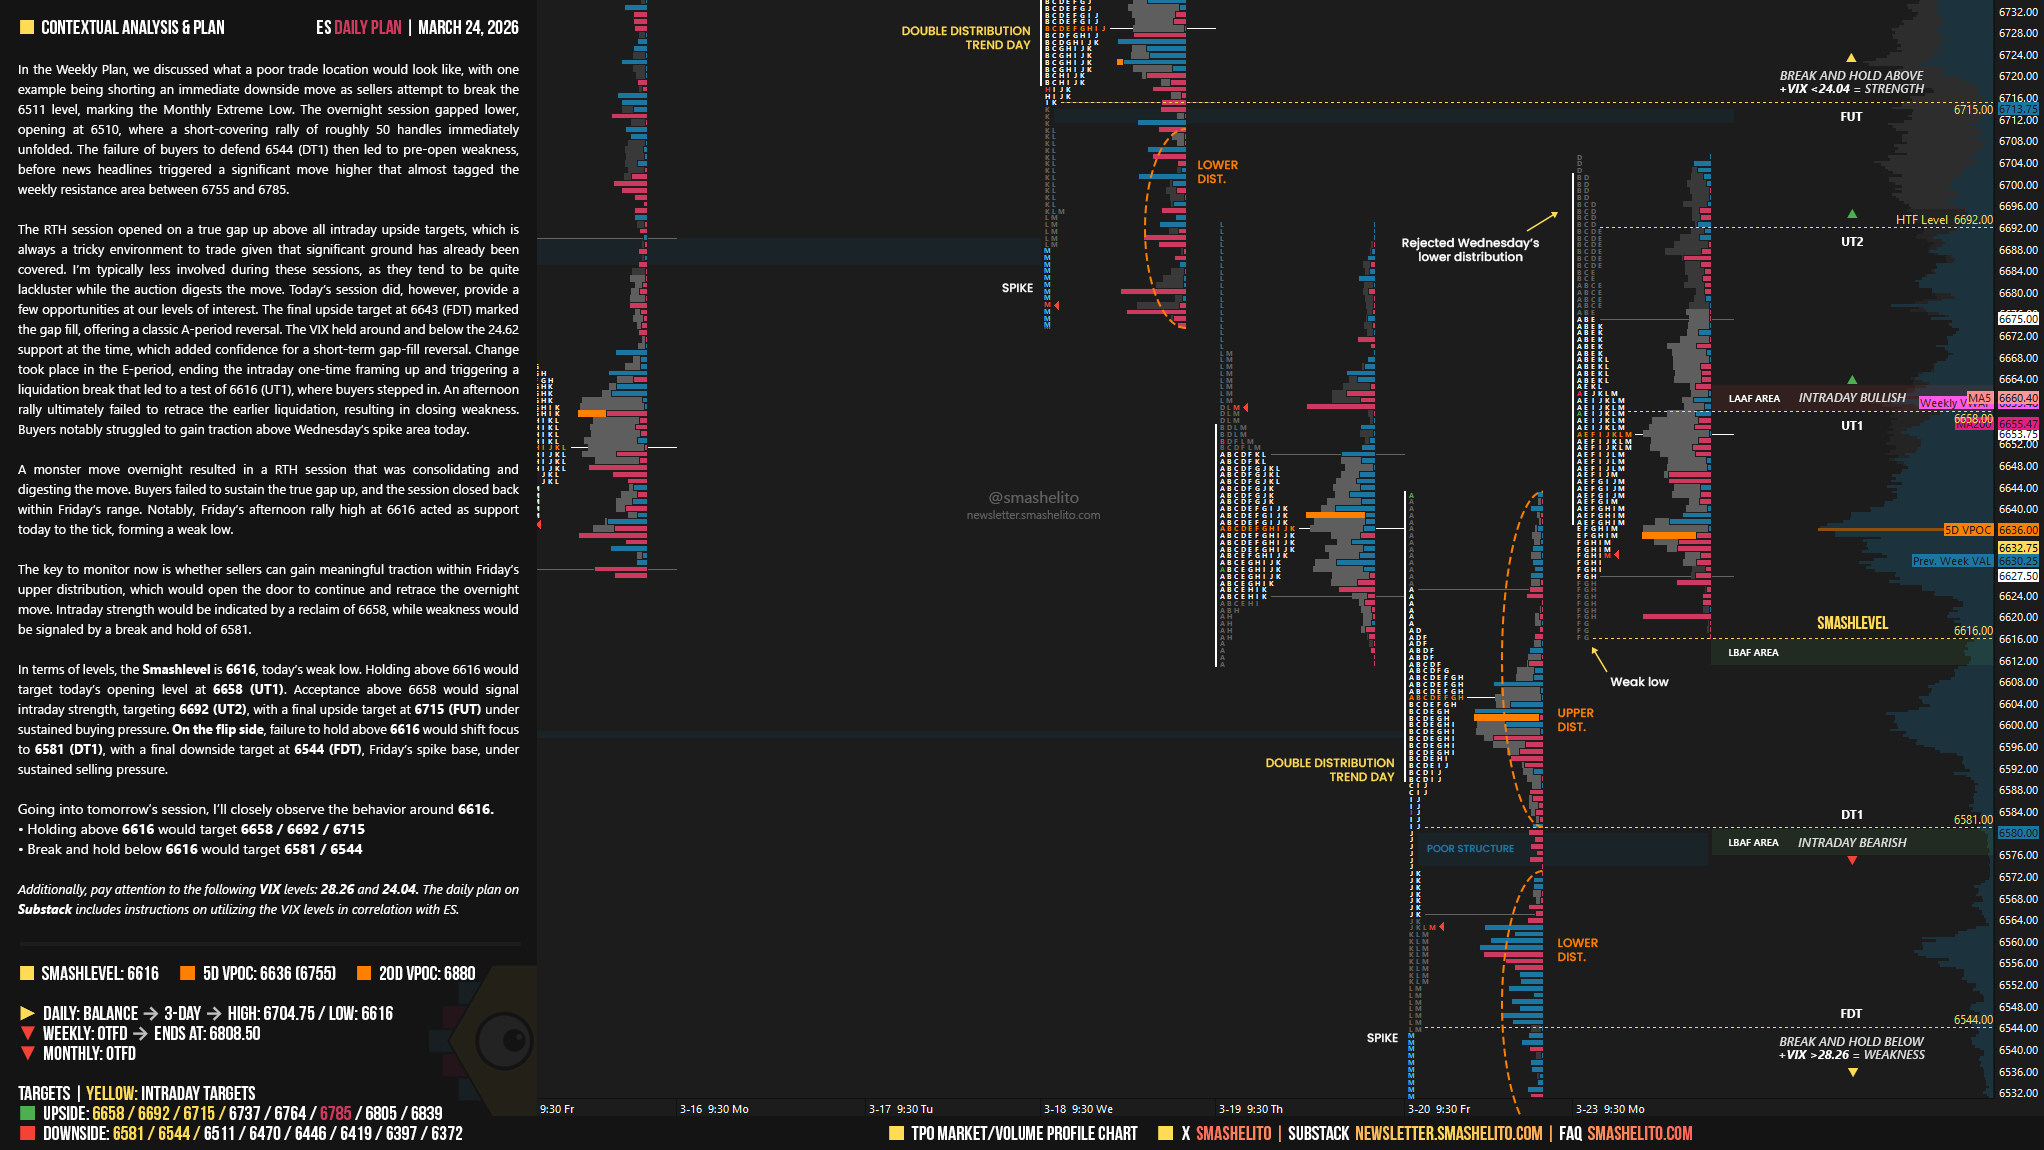
In the Weekly Plan, we discussed what a poor trade location would look like, with one example being shorting an immediate downside move as sellers attempt to break the 6511 level, marking the Monthly Extreme Low. The overnight session gapped lower, opening at 6510, where a short-covering rally of roughly 50 handles immediately unfolded. The failure of buyers to defend 6544 (DT1) then led to pre-open weakness, before news headlines triggered a significant move higher that almost tagged the weekly resistance area between 6755 and 6785.
The RTH session opened on a true gap up above all intraday upside targets, which is always a tricky environment to trade given that significant ground has already been covered. I’m typically less involved during these sessions, as they tend to be quite lackluster while the auction digests the move. Today’s session did, however, provide a few opportunities at our levels of interest. The final upside target at 6643 (FDT) marked the gap fill, offering a classic A-period reversal. The VIX held around and below the 24.62 support at the time, which added confidence for a short-term gap-fill reversal. Change took place in the E-period, ending the intraday one-time framing up and triggering a liquidation break that led to a test of 6616 (UT1), where buyers stepped in. An afternoon rally ultimately failed to retrace the earlier liquidation, resulting in closing weakness. Buyers notably struggled to gain traction above Wednesday’s spike area today.
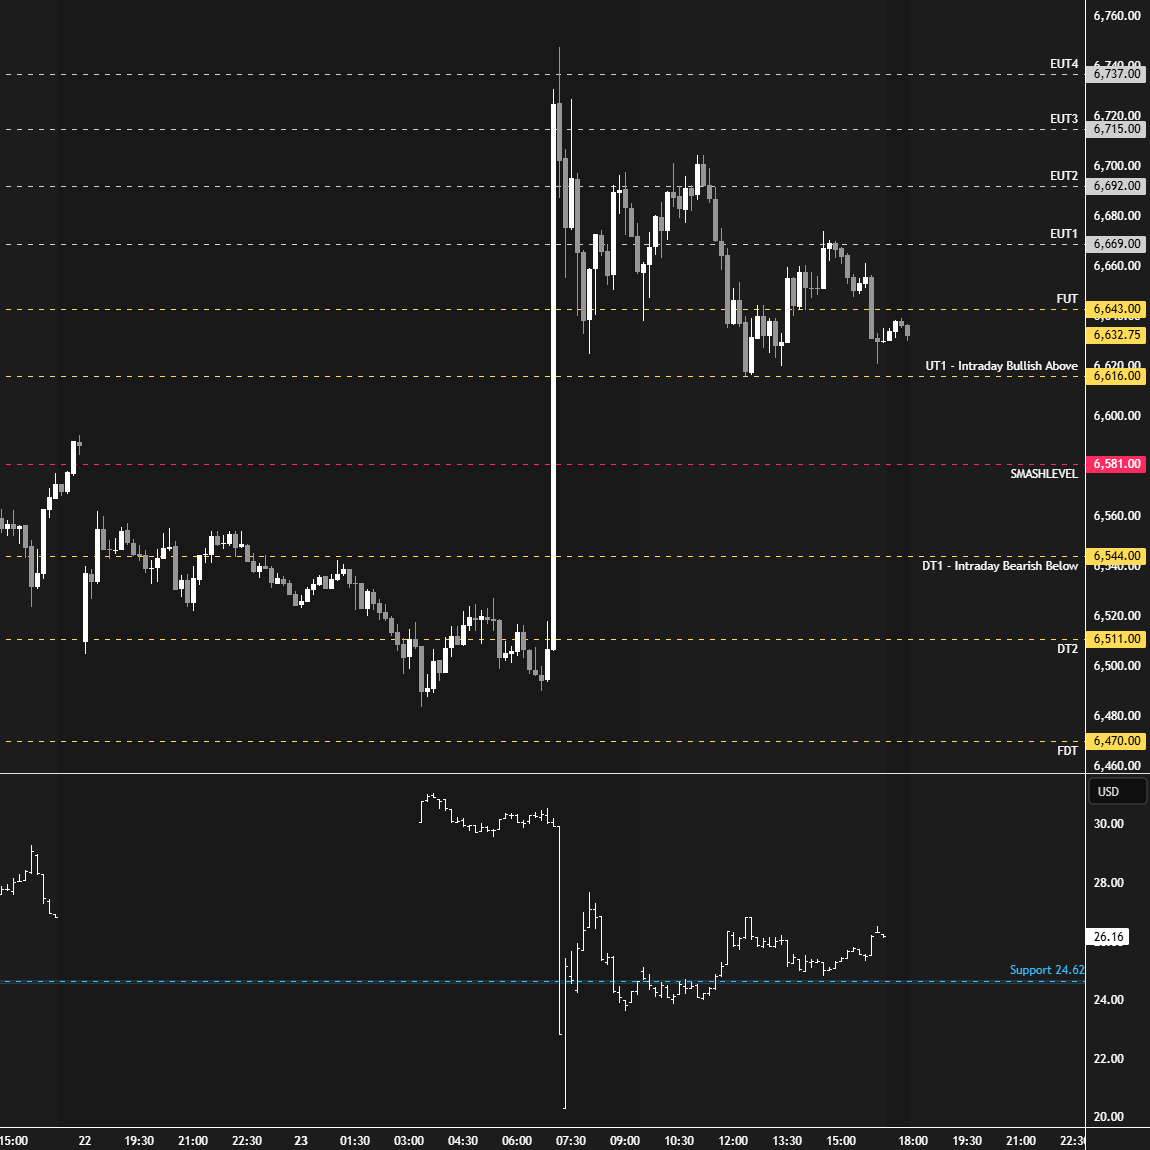
A monster move overnight resulted in a RTH session that was consolidating and digesting the move. Buyers failed to sustain the true gap up, and the session closed back within Friday’s range. Notably, Friday’s afternoon rally high at 6616 acted as support today to the tick, forming a weak low.
The key to monitor now is whether sellers can gain meaningful traction within Friday’s upper distribution, which would open the door to continue and retrace the overnight move. Intraday strength would be indicated by a reclaim of 6658, while weakness would be signaled by a break and hold of 6581.
In terms of levels, the Smashlevel is 6616, today’s weak low. Holding above 6616 would target today’s opening level at 6658 (UT1). Acceptance above 6658 would signal intraday strength, targeting 6692 (UT2), with a final upside target at 6715 (FUT) under sustained buying pressure.
On the flip side, failure to hold above 6616 would shift focus to 6581 (DT1), with a final downside target at 6544 (FDT), Friday’s spike base, under sustained selling pressure.
Levels of Interest
Going into tomorrow’s session, I’ll closely observe the behavior around 6616.
Holding above 6616 would target 6658 / 6692 / 6715
Break and hold below 6616 would target 6581 / 6544
Additionally, pay attention to the following VIX levels: 28.26 and 24.04. These levels can provide confirmation of strength or weakness.
Break and hold above 6715 with VIX below 24.04 would confirm strength.
Break and hold below 6544 with VIX above 28.26 would confirm weakness.
Overall, it's important to exercise caution when trading outside of the highlighted yellow levels. A non-cooperative VIX may suggest possible reversals i.e trade setups.
Thanks Smash for the analysis, have a great session tomorrow
Thanks Smash!