
ES Daily Plan | March 20, 2026
Market Context & Key Levels for the Day Ahead

— For new subscribers
The yellow levels highlighted at the bottom left of the chart are the primary intraday levels I focus on. To avoid impulsive decisions at poor trade locations, I follow a simple but effective rule: exercise caution when initiating trades outside of these yellow levels.
This means I’m cautious about chasing longs above the Final Upside Target (FUT) and shorts below the Final Downside Target (FDT). It’s important to understand that not chasing does not imply initiating a trade in the opposite direction — discipline over impulse.
Be sure to review the Weekly Plan for a broader perspective, key levels, and market expectations for the week ahead.

Contract Rollover
A quick reminder: I’ve switched to the ESM26 (June) contract. For reference, I do not back-adjust my charts.
“Contract rollovers can be confusing. While some traders choose to back-adjust their charts, I prefer to leave historical levels unchanged, which results in a visible roll gap. This is a matter of personal preference—neither approach is inherently better, as both have pros and cons. For short-term traders, the impact is generally minimal, since we navigate the market day by day. I typically scale back activity during rollover periods, as order flow tends to become noticeably less reliable.”
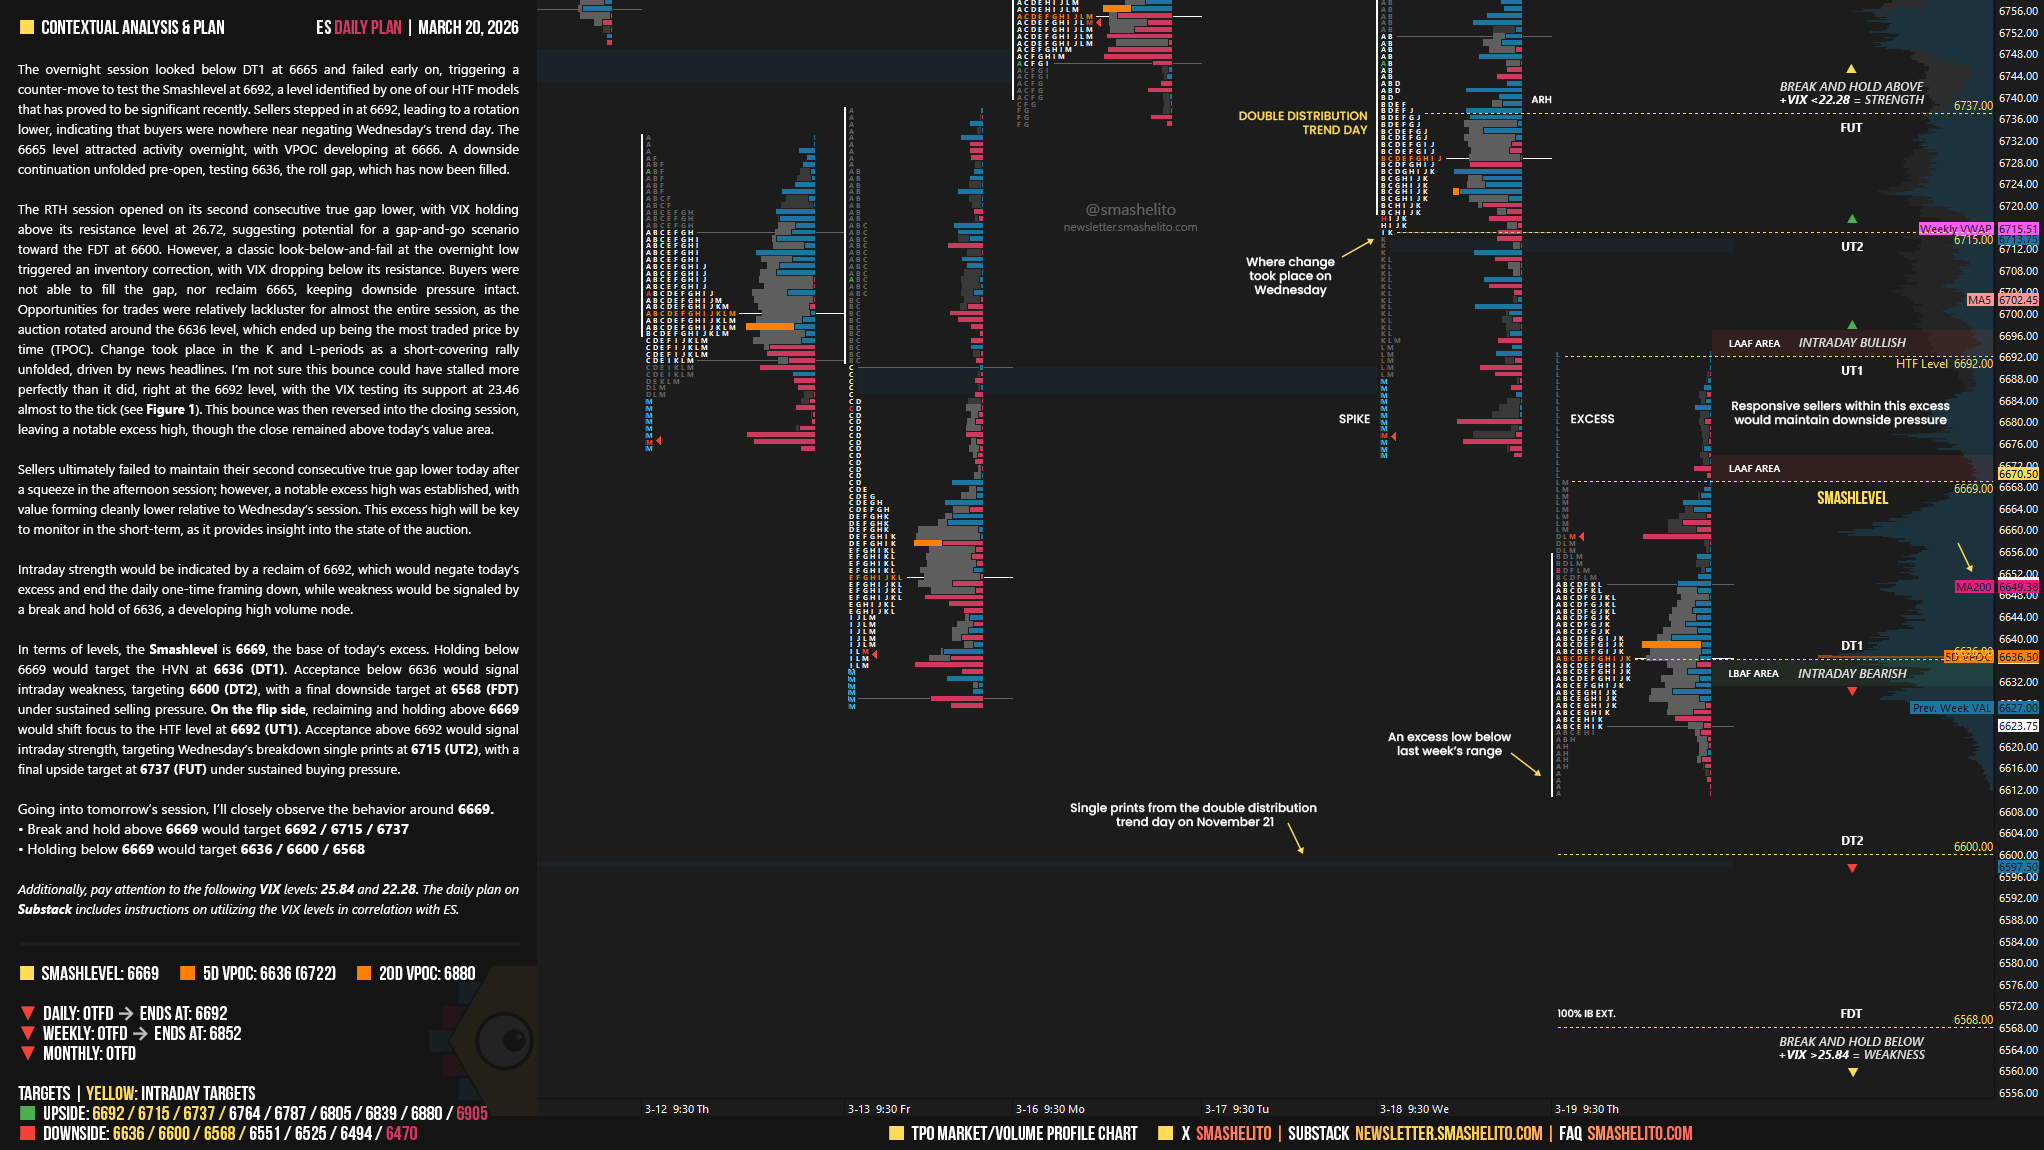
Contextual Analysis & Plan
The overnight session looked below DT1 at 6665 and failed early on, triggering a counter-move to test the Smashlevel at 6692, a level identified by one of our HTF models that has proved to be significant recently. Sellers stepped in at 6692, leading to a rotation lower, indicating that buyers were nowhere near negating Wednesday’s trend day. The 6665 level attracted activity overnight, with VPOC developing at 6666. A downside continuation unfolded pre-open, testing 6636, the roll gap, which has now been filled.
The RTH session opened on its second consecutive true gap lower, with VIX holding above its resistance level at 26.72, suggesting potential for a gap-and-go scenario toward the FDT at 6600. However, a classic look-below-and-fail at the overnight low triggered an inventory correction, with VIX dropping below its resistance. Buyers were not able to fill the gap, nor reclaim 6665, keeping downside pressure intact. Opportunities for trades were relatively lackluster for almost the entire session, as the auction rotated around the 6636 level, which ended up being the most traded price by time (TPOC). Change took place in the K and L-periods as a short-covering rally unfolded, driven by news headlines. I’m not sure this bounce could have stalled more perfectly than it did, right at the 6692 level, with the VIX testing its support at 23.46 almost to the tick (see Figure 1). This bounce was then reversed into the closing session, leaving a notable excess high, though the close remained above today’s value area.
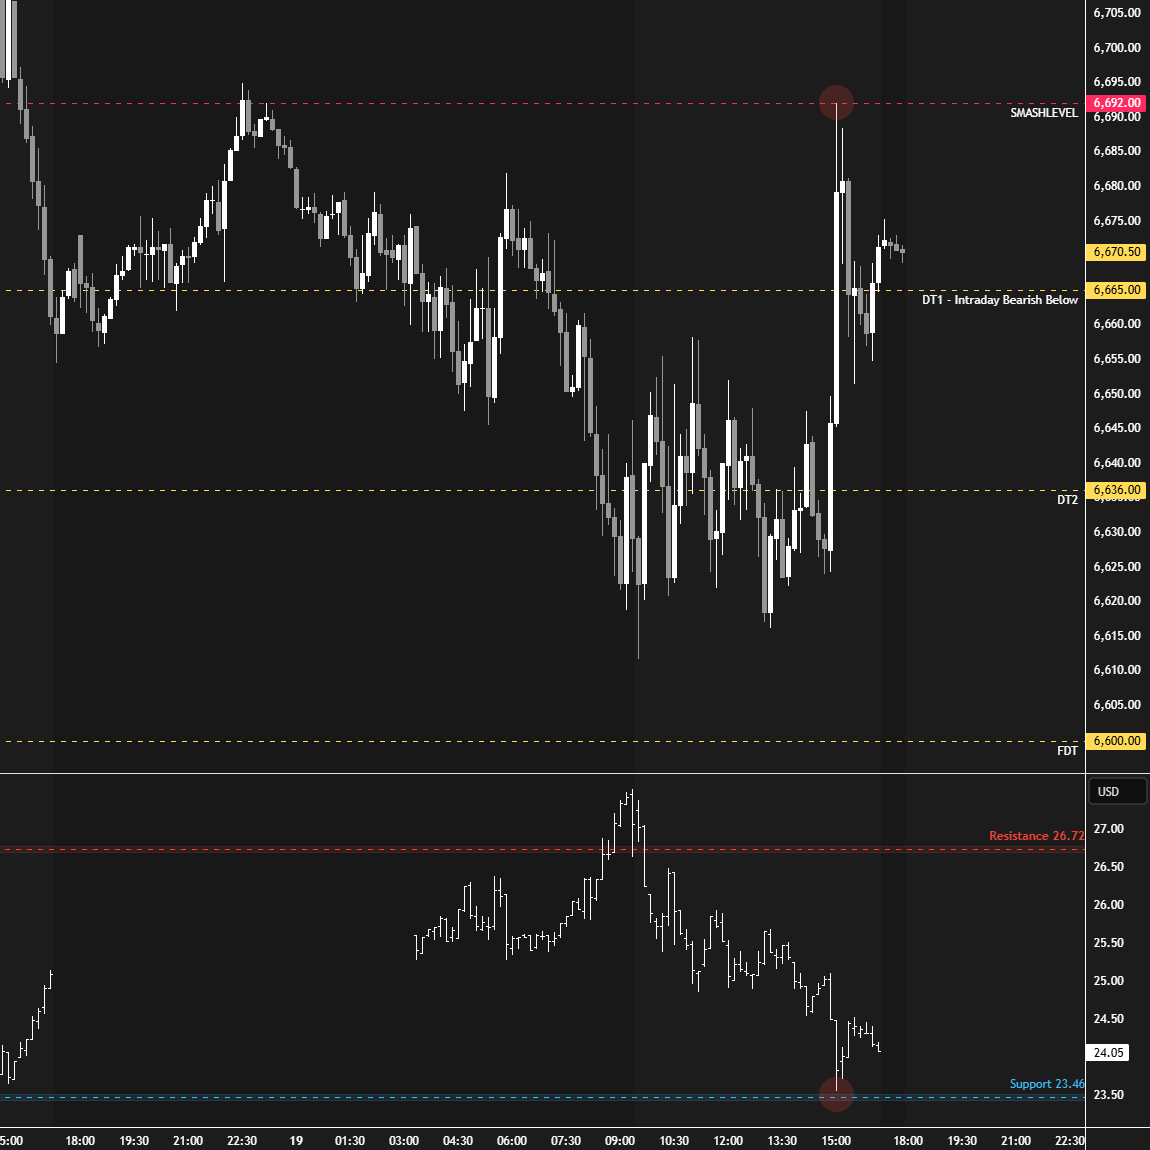
Sellers ultimately failed to maintain their second consecutive true gap lower today after a squeeze in the afternoon session; however, a notable excess high was established, with value forming cleanly lower relative to Wednesday’s session. This excess high will be key to monitor in the short-term, as it provides insight into the state of the auction.
Intraday strength would be indicated by a reclaim of 6692, which would negate today’s excess and end the daily one-time framing down, while weakness would be signaled by a break and hold of 6636, a developing high volume node.
In terms of levels, the Smashlevel is 6669, the base of today’s excess. Holding below 6669 would target the HVN at 6636 (DT1). Acceptance below 6636 would signal intraday weakness, targeting 6600 (DT2), with a final downside target at 6568 (FDT) under sustained selling pressure.
On the flip side, reclaiming and holding above 6669 would shift focus to the HTF level at 6692 (UT1). Acceptance above 6692 would signal intraday strength, targeting Wednesday’s breakdown single prints at 6715 (UT2), with a final upside target at 6737 (FUT) under sustained buying pressure.
Levels of Interest
Going into tomorrow’s session, I’ll closely observe the behavior around 6669.
Break and hold above 6669 would target 6692 / 6715 / 6737
Holding below 6669 would target 6636 / 6600 / 6568
Additionally, pay attention to the following VIX levels: 25.84 and 22.28. These levels can provide confirmation of strength or weakness.
Break and hold above 6737 with VIX below 22.28 would confirm strength.
Break and hold below 6568 with VIX above 25.84 would confirm weakness.
Overall, it's important to exercise caution when trading outside of the highlighted yellow levels. A non-cooperative VIX may suggest possible reversals i.e trade setups.
Thank you for the high-quality information. As you mentioned at the beginning of the week, will we see a market similar to last week? It seems so. It's key to observe tomorrow's weakness. Thank you so much for teaching me so much; you have a loyal follower and student here always.
Absolute perfection! Thank Smash.