
ES Weekly Plan | March 16-20, 2026
Recap, Market Context & Key Levels for the Week Ahead

Welcome to this week’s plan. Inside, you’ll find a quick review of last week’s price action, key economic events, market structure, context for the week ahead, and the levels I’ll be focusing on. Let’s get prepared.
Contents
Last Week in Review
Economic & Earnings Calendar
Market Structure
Contract Rollover
Contextual Analysis & Plan
Key Levels of Interest
Last Week in Review
Last week’s plan:

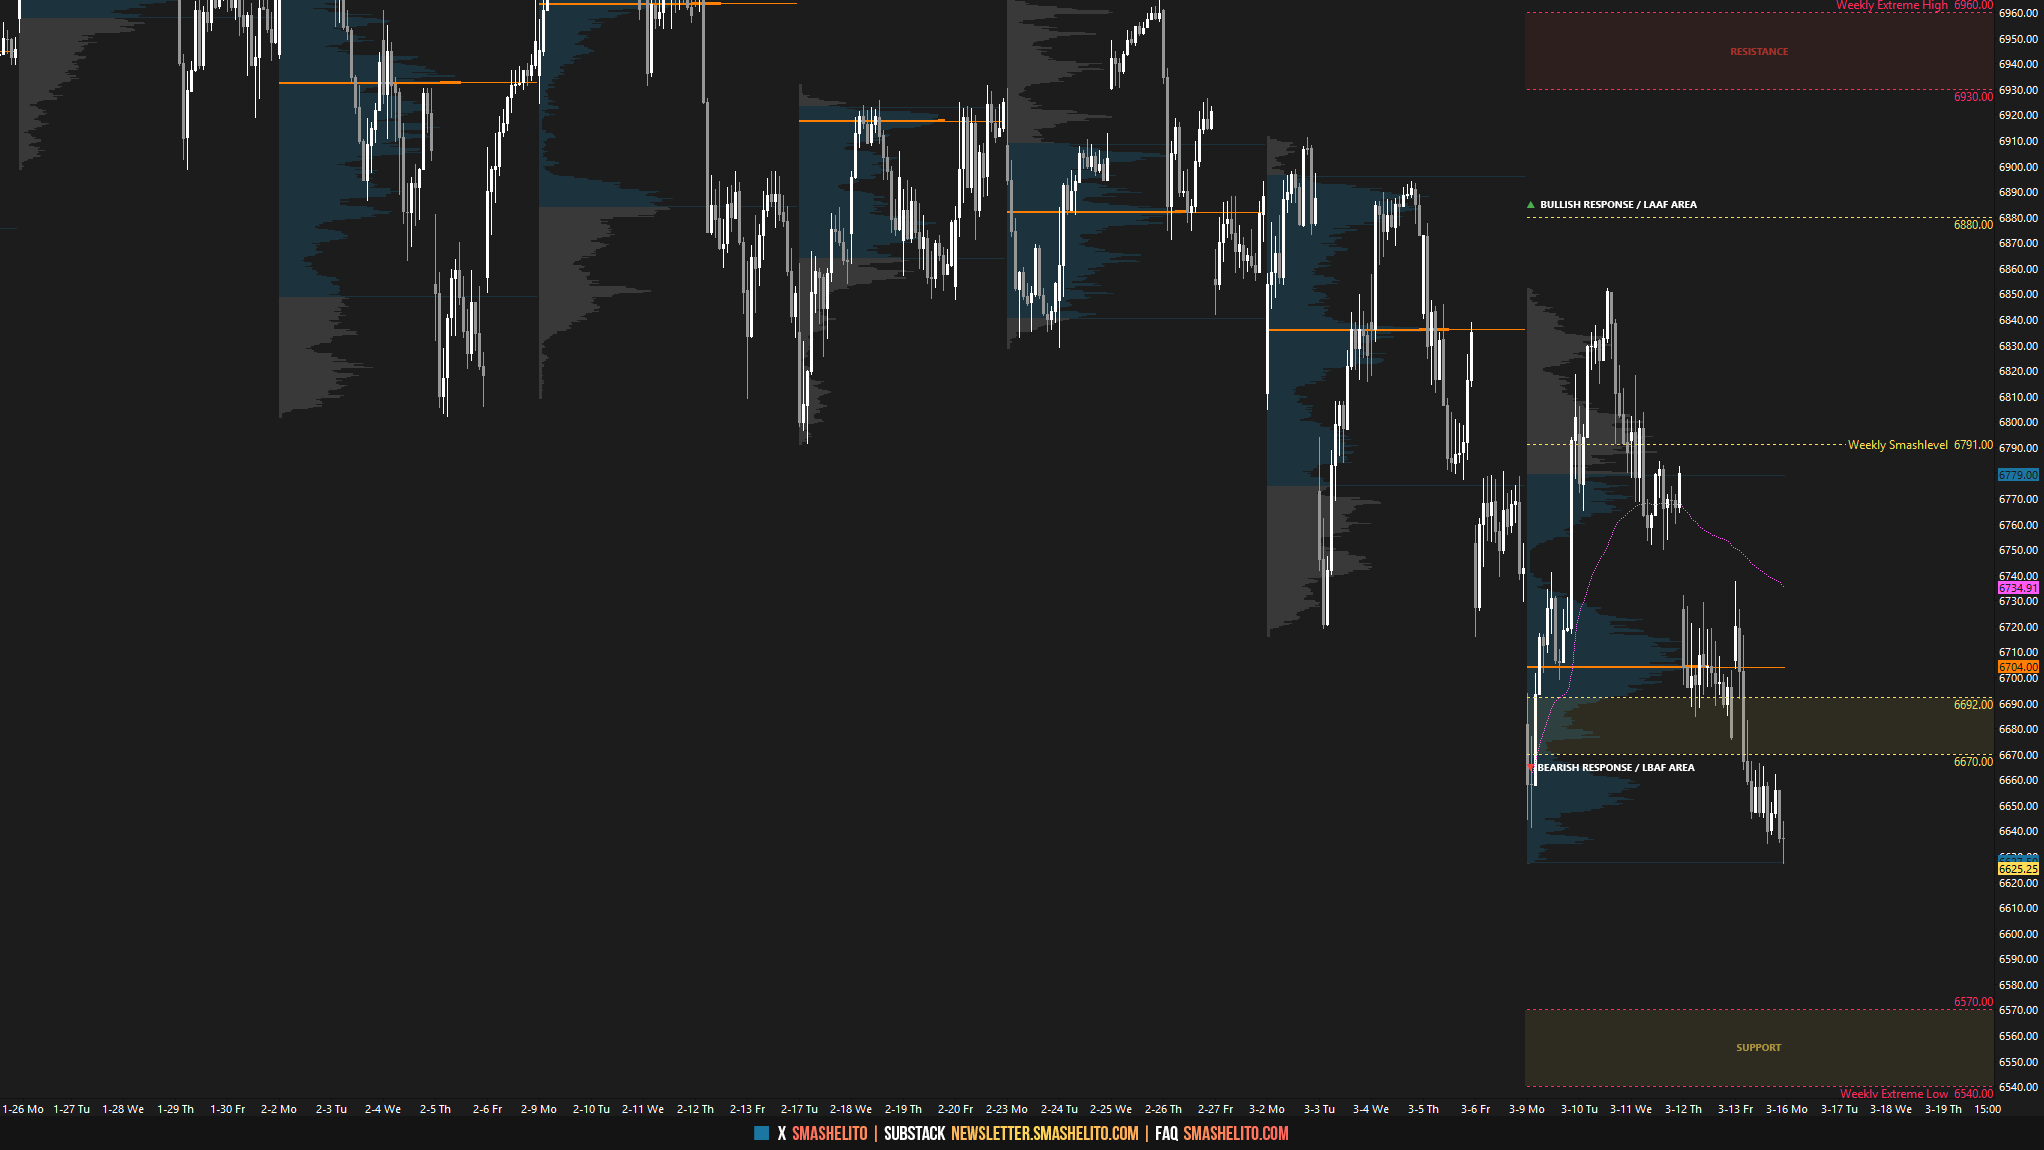
Last week, the market kicked off with a double distribution trend day to the upside on Monday, following a look-below-and-fail of the 6692–6670 support area. The session closed back within the prior multi-week balance area, forming a large set of single prints separating the two distributions.
The key question for the rest of the week was whether buyers could establish acceptance within the prior multi-week balance, or at least hold the trend day by not allowing sellers back within Monday’s lower distribution.
On Tuesday and Wednesday, the market was essentially consolidating Monday’s gains, partially filling the large set of single prints, which was bullish until proven otherwise. Change took place on Thursday, as the market saw a true gap down, opening within Monday’s lower distribution, quickly trapping traders and negating the early-week strength.
Thursday’s true gap remained unfilled, and during Friday’s session it was partially filled before selling stepped in aggressively, ultimately forming an outside day down and closing the session at its lows, right at the daily MA200.
I will be switching to the ESM26 (June) contract on Monday, but Monday’s plan will include daily levels for both the ESM26 and ESH26 contracts, since the continuous contract on TradingView typically rolls over on Tuesday.
Last Week’s Levels in Review
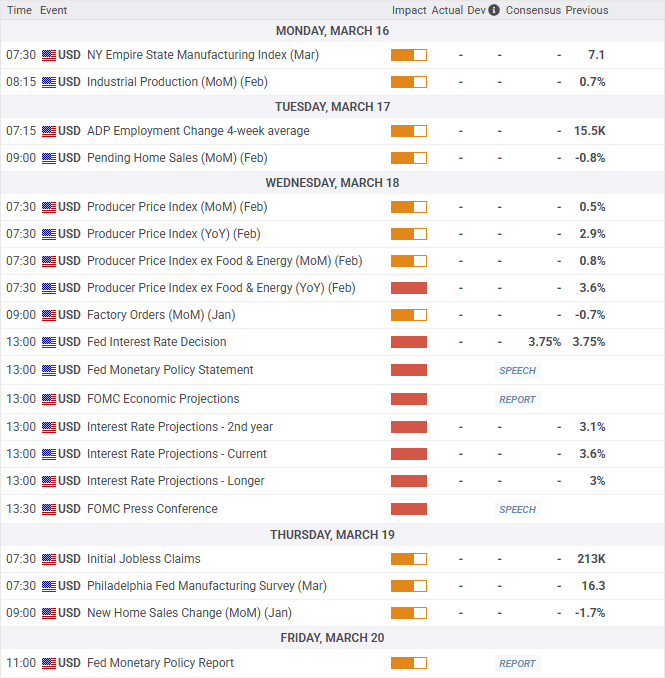
Economic & Earnings Calendar
Central Standard Time
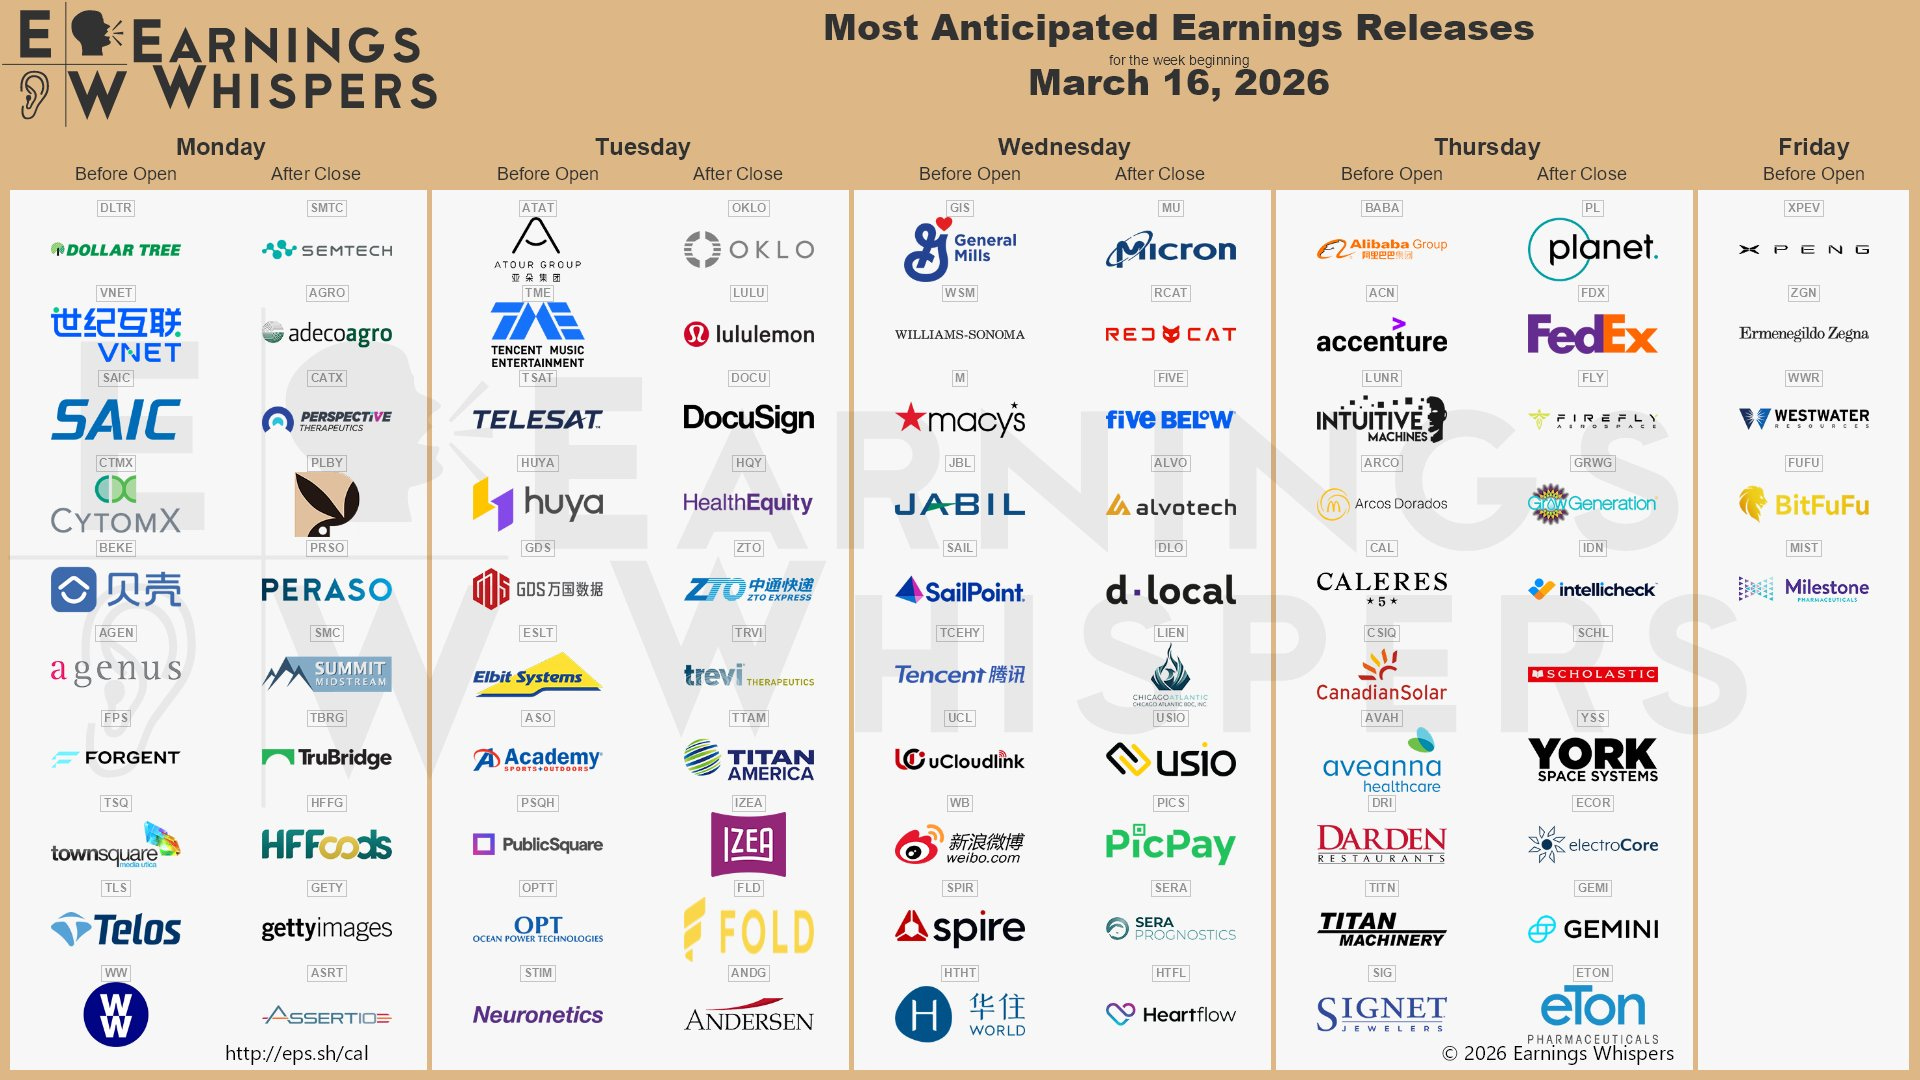
Earnings Whispers
Market Structure
🟥 Daily: OTFD → Ends at: 6737.50
🟥 Weekly: OTFD → Ends at: 6852
🟥 Monthly: OTFD
Balance: A market condition where price consolidates within a defined range, reflecting indecision as the market awaits more market-generated information. We apply balance guidelines—favoring fade trades at range extremes (highs/lows) and preparing for breakout setups if balance resolves.
One-Time Framing Up (OTFU): A market condition where each subsequent bar forms a higher low, signaling a strong upward trend.
One-Time Framing Down (OTFD): A market condition where each subsequent bar forms a lower high, signaling a strong downward trend.
FYI: During rollover, one-time framing and balance can look distorted because of the roll gap. I don’t back-adjust my charts, so expect these concepts to be temporarily skewed.
Contract Rollover
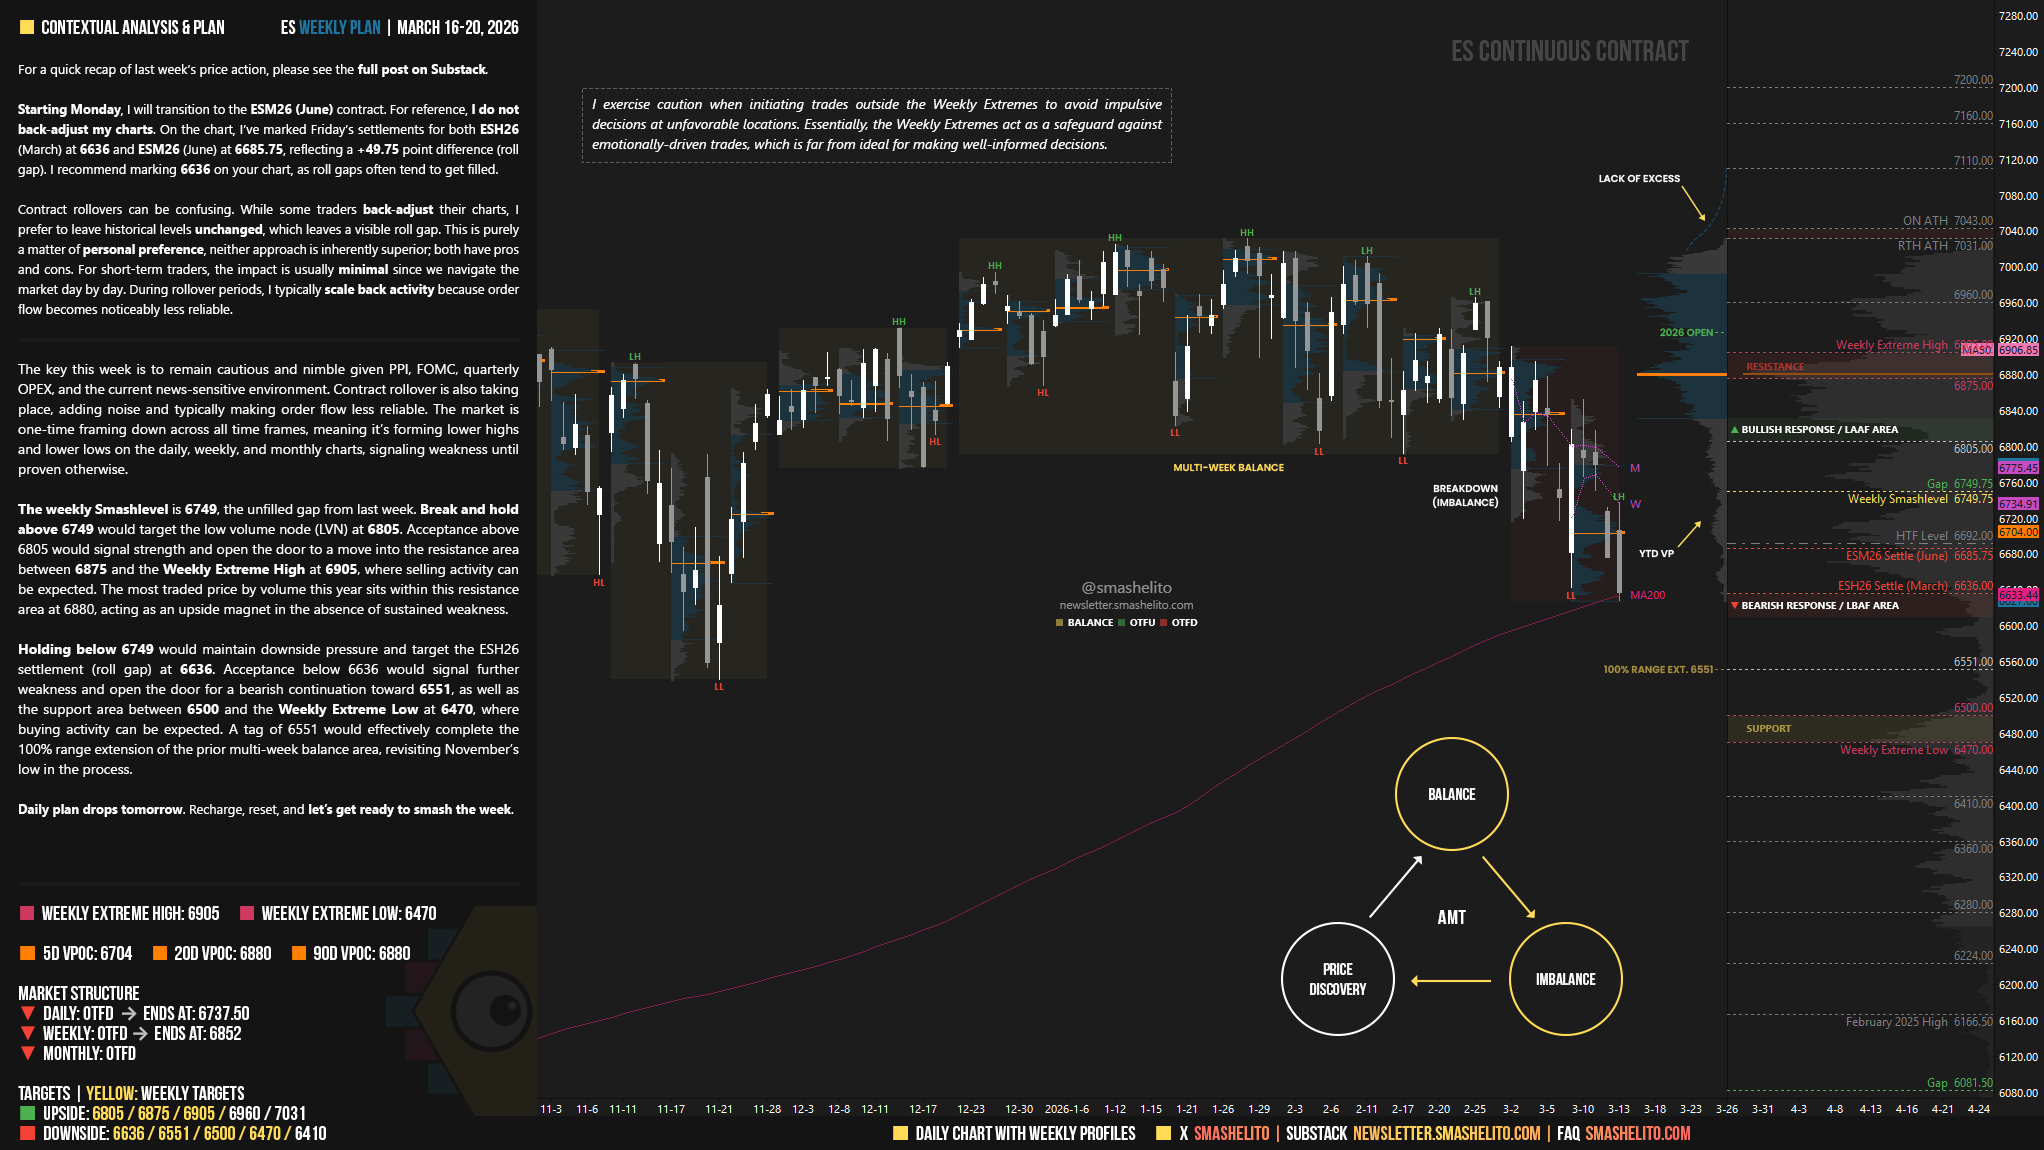
Starting Monday, I will transition to the ESM26 (June) contract.
For reference, I do not back-adjust my charts. On the chart, I’ve marked Friday’s settlements for both ESH26 (March) at 6636 and ESM26 (June) at 6685.75, reflecting a +49.75 point difference (roll gap).
I recommend marking 6636 on your chart, as roll gaps often tend to get filled.
Contract rollovers can be confusing. While some traders back-adjust their charts, I prefer to leave historical levels unchanged, which leaves a visible roll gap. This is purely a matter of personal preference, neither approach is inherently superior; both have pros and cons.
For short-term traders, the impact is usually minimal since we navigate the market day by day. During rollover periods, I typically scale back activity because order flow becomes noticeably less reliable.
Contextual Analysis & Plan
The key this week is to remain cautious and nimble given PPI, FOMC, quarterly OPEX, and the current news-sensitive environment. Contract rollover is also taking place, adding noise and typically making order flow less reliable.
The market is one-time framing down across all time frames, meaning it’s forming lower highs and lower lows on the daily, weekly, and monthly charts, signaling weakness until proven otherwise.
The weekly Smashlevel is 6749, the unfilled gap from last week. Break and hold above 6749 would target the low volume node (LVN) at 6805. Acceptance above 6805 would signal strength and open the door to a move into the resistance area between 6875 and the Weekly Extreme High at 6905, where selling activity can be expected. The most traded price by volume this year sits within this resistance area at 6880, acting as an upside magnet in the absence of sustained weakness.
Holding below 6749 would maintain downside pressure and target the ESH26 settlement (roll gap) at 6636. Acceptance below 6636 would signal further weakness and open the door for a bearish continuation toward 6551, as well as the support area between 6500 and the Weekly Extreme Low at 6470, where buying activity can be expected. A tag of 6551 would effectively complete the 100% range extension of the prior multi-week balance area, revisiting November’s low in the process.
Key Levels of Interest
In the upcoming week, I will closely observe the behavior around 6749.
Break and hold above 6749 would target 6805 / 6875 / 6905* / 6960 / 7031
Holding below 6749 would target 6636 / 6551 / 6500 / 6470* / 6410
*Weekly Extremes (defined by proprietary models). I exercise caution when initiating trades outside the Weekly Extremes to avoid impulsive decisions at unfavorable locations. Essentially, the Weekly Extremes act as a safeguard against emotionally-driven trades, which is far from ideal for making well-informed decisions.
Daily plan drops tomorrow. Recharge, reset, and let’s get ready to smash the week.
Thank you Smash 💥
Thank you as always!