ES Daily Plan | March 20, 2025
Key Levels & Market Context for the Upcoming Session.
For new followers: The yellow levels highlighted at the bottom left of the chart are the primary levels that I focus on intraday. My strategy for preventing impulsive decisions at unfavorable locations involves following a simple yet effective rule of exercising caution when initiating trades outside of the yellow levels. This implies that I am cautious chasing longs above the final yellow upside target and shorts below the final yellow downside target. It is crucial to understand that refraining from chasing a trade is not an automatic invitation to initiate a trade in the opposite direction.
Visual Representation
Contextual Analysis
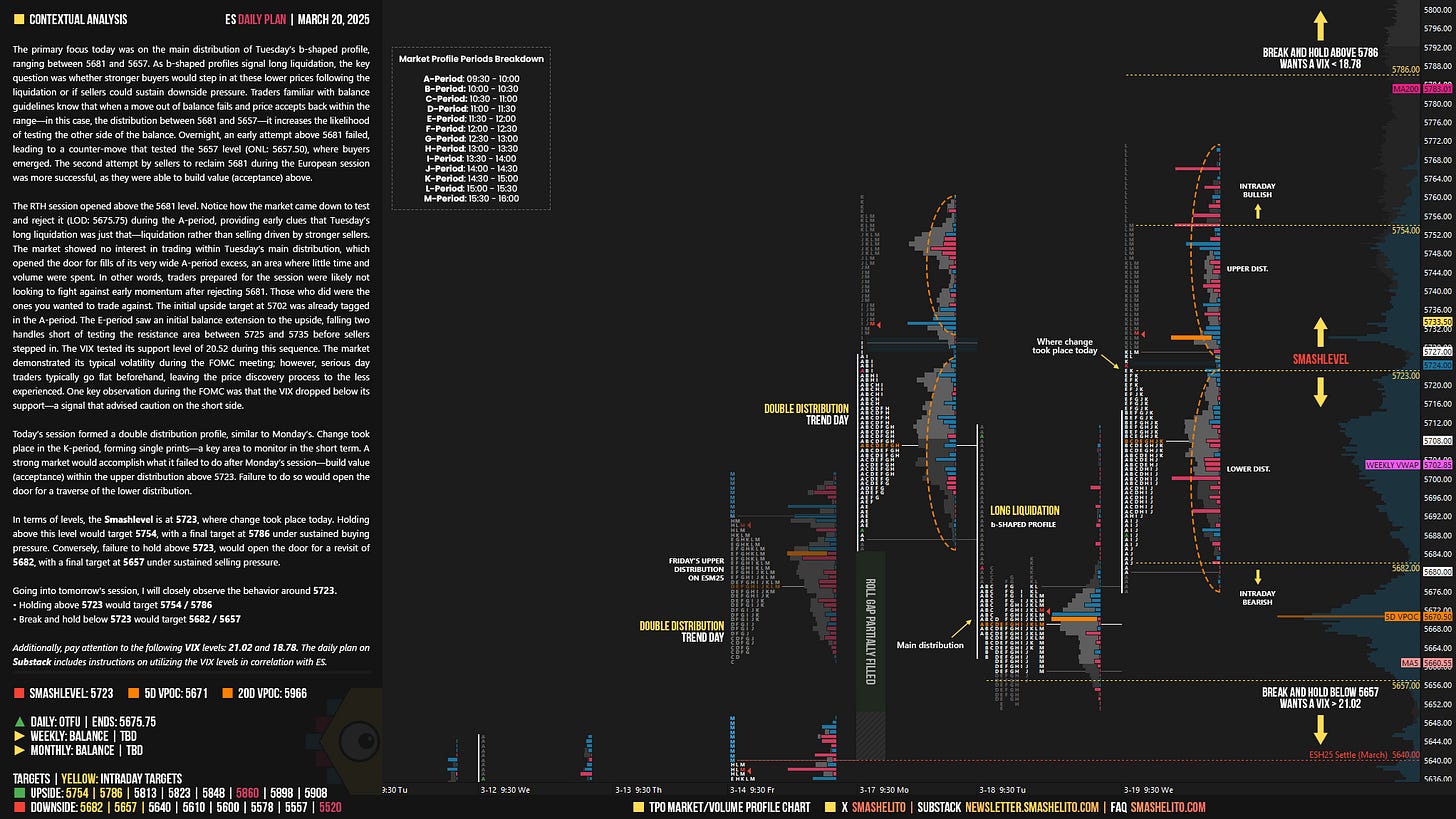
The primary focus today was on the main distribution of Tuesday’s b-shaped profile, ranging between 5681 and 5657. As b-shaped profiles signal long liquidation, the key question was whether stronger buyers would step in at these lower prices following the liquidation or if sellers could sustain downside pressure. Traders familiar with balance guidelines know that when a move out of balance fails and price accepts back within the range—in this case, the distribution between 5681 and 5657—it increases the likelihood of testing the other side of the balance. Overnight, an early attempt above 5681 failed, leading to a counter-move that tested the 5657 level (ONL: 5657.50), where buyers emerged. The second attempt by sellers to reclaim 5681 during the European session was more successful, as they were able to build value (acceptance) above.
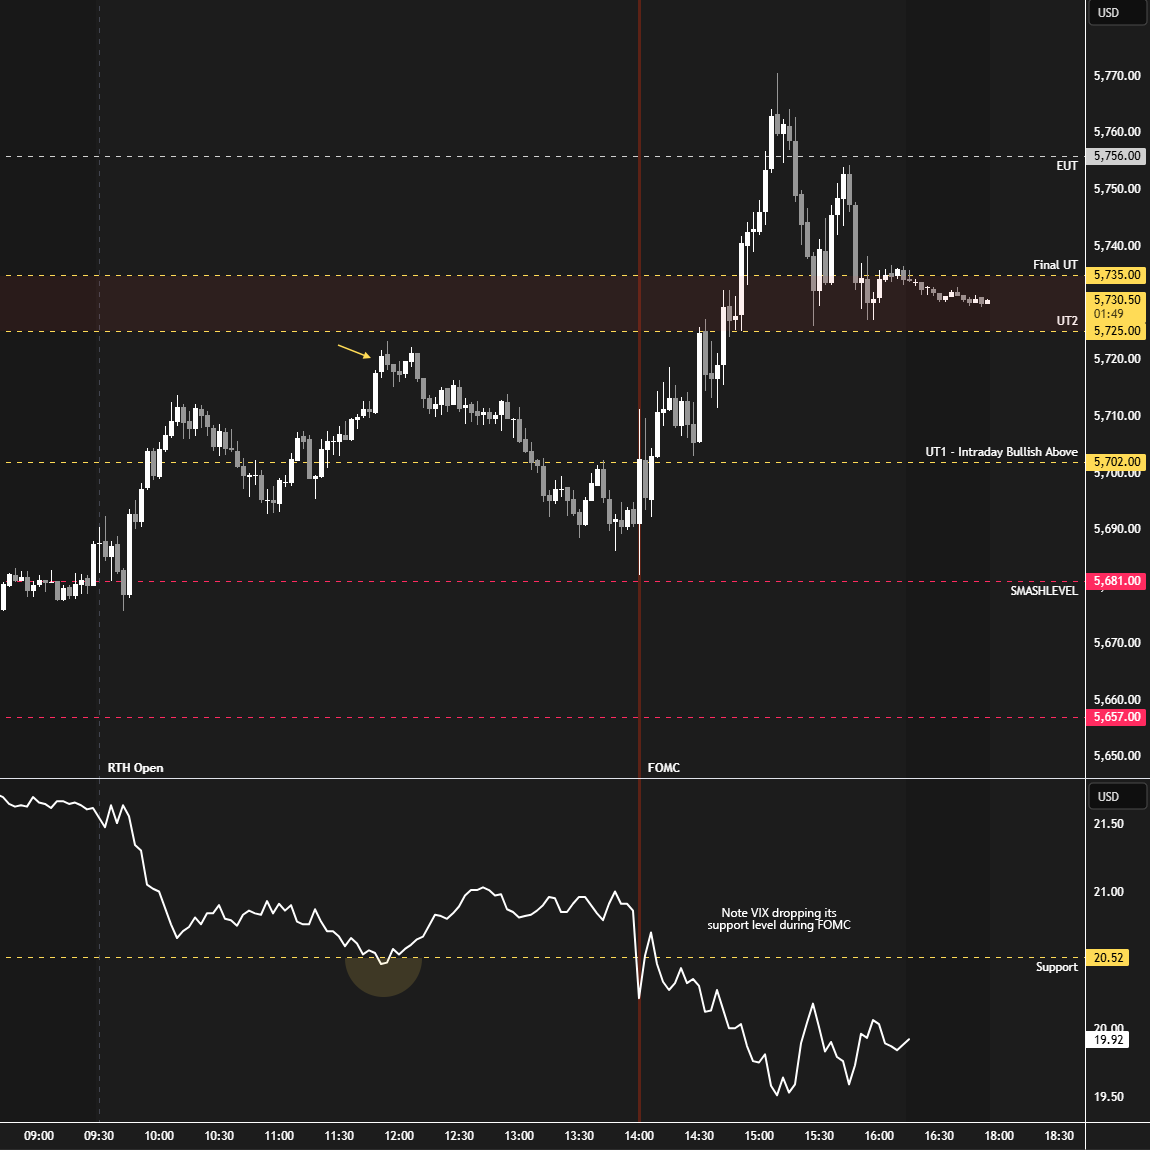
The RTH session opened above the 5681 level. Notice how the market came down to test and reject it (LOD: 5675.75) during the A-period, providing early clues that Tuesday’s long liquidation was just that—liquidation rather than selling driven by stronger sellers. The market showed no interest in trading within Tuesday’s main distribution, which opened the door for fills of its very wide A-period excess, an area where little time and volume were spent. In other words, traders prepared for the session were likely not looking to fight against early momentum after rejecting 5681. Those who did were the ones you wanted to trade against. The initial upside target at 5702 was already tagged in the A-period.
The E-period saw an initial balance extension to the upside, falling two handles short of testing the resistance area between 5725 and 5735 before sellers stepped in. The VIX tested its support level of 20.52 during this sequence. The market demonstrated its typical volatility during the FOMC meeting; however, serious day traders typically go flat beforehand, leaving the price discovery process to the less experienced. One key observation during the FOMC was that the VIX dropped below its support—a signal that advised caution on the short side.
Today’s session formed a double distribution profile, similar to Monday’s. Change took place in the K-period, forming single prints—a key area to monitor in the short term. A strong market would accomplish what it failed to do after Monday’s session—build value (acceptance) within the upper distribution above 5723. Failure to do so would open the door for a traverse of the lower distribution.
In terms of levels, the Smashlevel is at 5723, where change took place today. Holding above this level would target 5754, with a final target at 5786 under sustained buying pressure. Conversely, failure to hold above 5723, would open the door for a revisit of 5682, with a final target at 5657 under sustained selling pressure.
Levels of Interest
Going into tomorrow's session, I will closely observe the behavior around 5723.
Holding above 5723 would target 5754 / 5786
Break and hold below 5723 would target 5682 / 5657
Additionally, pay attention to the following VIX levels: 21.02 and 18.78. These levels can provide confirmation of strength or weakness.
Break and hold above 5786 with VIX below 18.78 would confirm strength.
Break and hold below 5657 with VIX above 21.02 would confirm weakness.
Overall, it's important to exercise caution when trading outside of the highlighted yellow levels. A non-cooperative VIX may suggest possible reversals i.e trade setups.
Weekly Plan
Make sure to review the Weekly Plan, which provides a broader perspective and highlights key levels of interest to observe in the upcoming week.


Is that 5682 level based on thise imbalnces from 82-86 that were created on first move up in the morning and later revisited only during initial impulse move from 1100 est meeting move?
Grazie Smash!