
ES Daily Plan | March 19, 2026
Market Context & Key Levels for the Day Ahead

— For new subscribers
The yellow levels highlighted at the bottom left of the chart are the primary intraday levels I focus on. To avoid impulsive decisions at poor trade locations, I follow a simple but effective rule: exercise caution when initiating trades outside of these yellow levels.
This means I’m cautious about chasing longs above the Final Upside Target (FUT) and shorts below the Final Downside Target (FDT). It’s important to understand that not chasing does not imply initiating a trade in the opposite direction — discipline over impulse.
Be sure to review the Weekly Plan for a broader perspective, key levels, and market expectations for the week ahead.

Contract Rollover
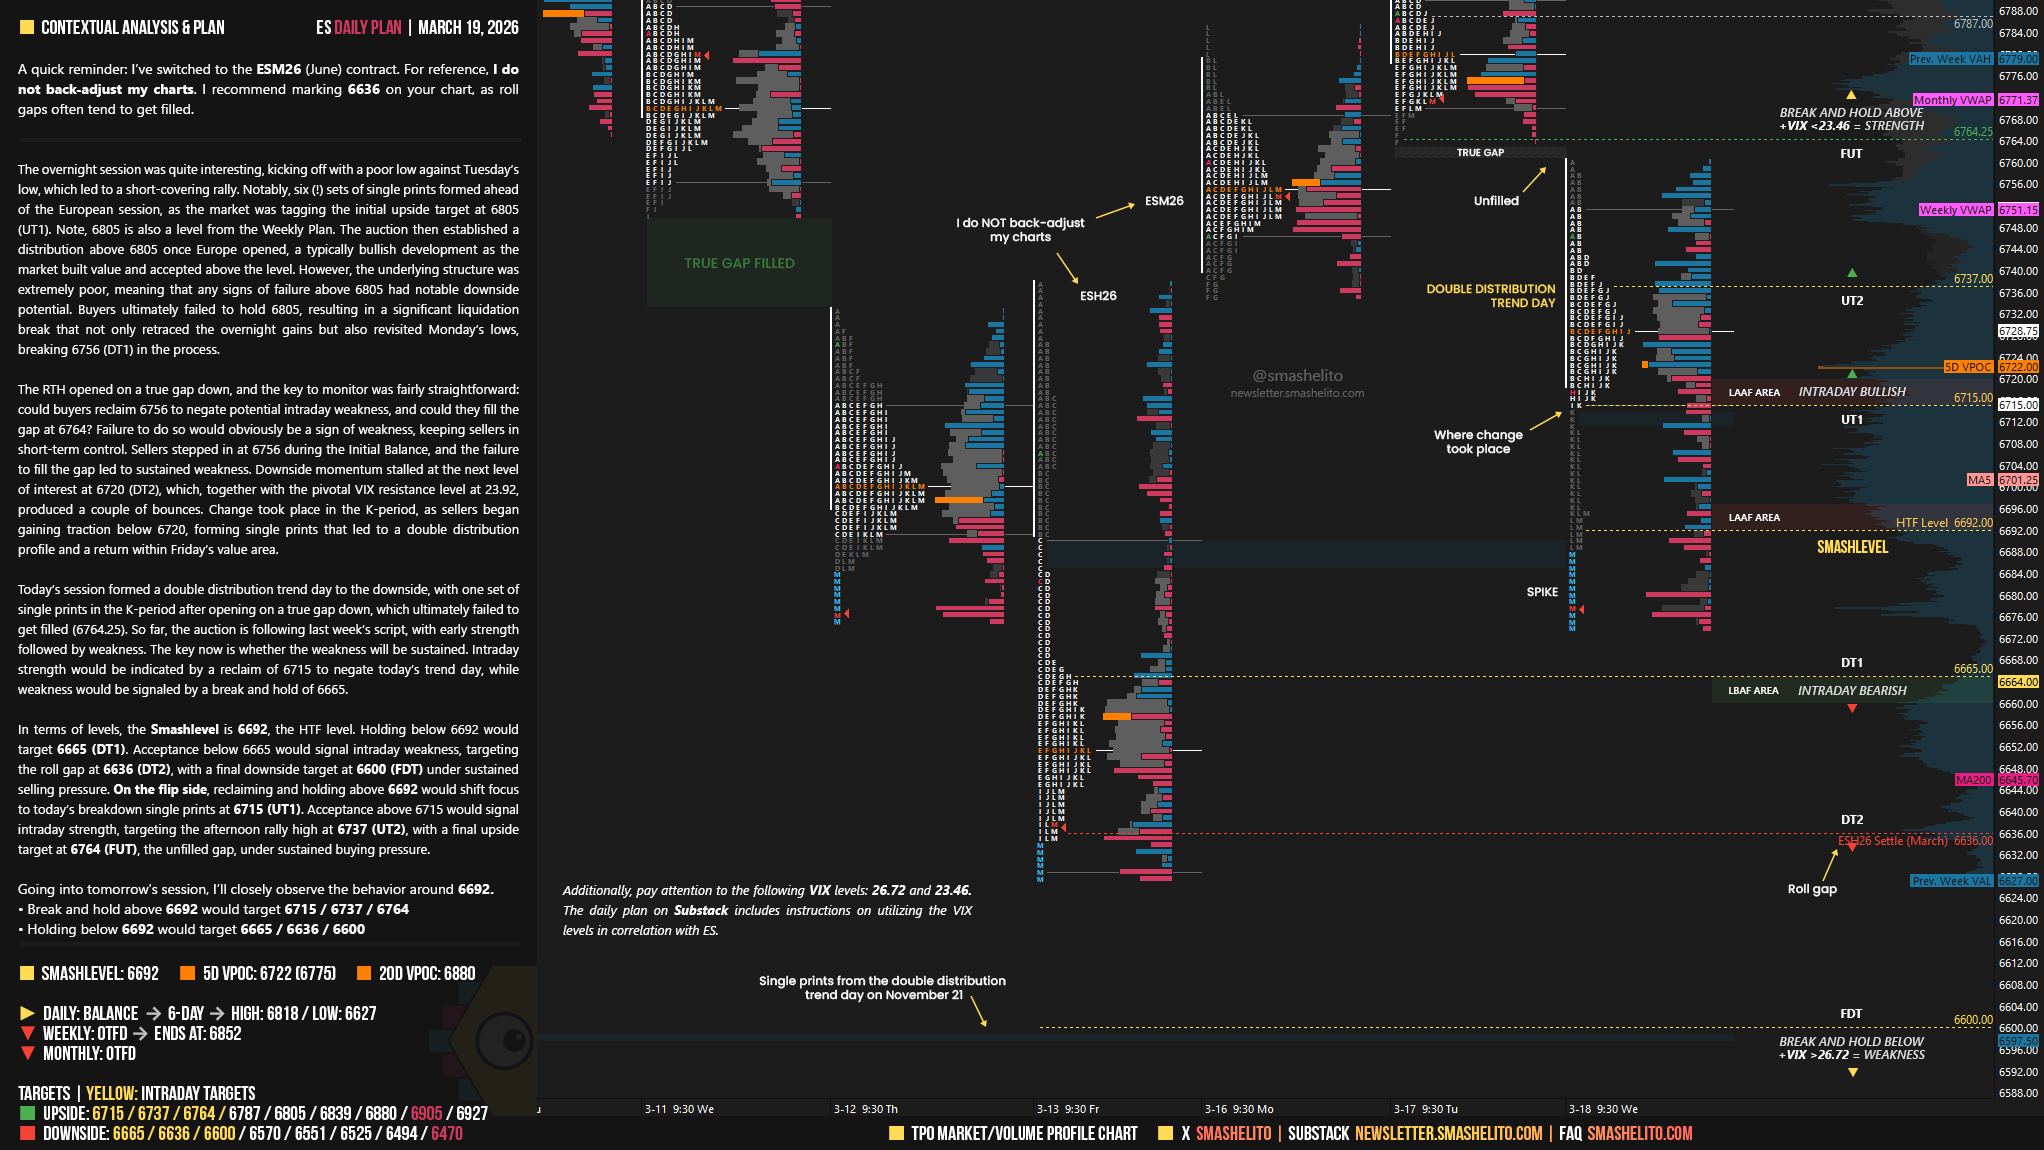
A quick reminder: I’ve switched to the ESM26 (June) contract. For reference, I do not back-adjust my charts. I recommend marking 6636 on your chart, as roll gaps often tend to get filled.
“Contract rollovers can be confusing. While some traders choose to back-adjust their charts, I prefer to leave historical levels unchanged, which results in a visible roll gap. This is a matter of personal preference—neither approach is inherently better, as both have pros and cons. For short-term traders, the impact is generally minimal, since we navigate the market day by day. I typically scale back activity during rollover periods, as order flow tends to become noticeably less reliable.”
Contextual Analysis & Plan
The overnight session was quite interesting, kicking off with a poor low against Tuesday’s low, which led to a short-covering rally. Notably, six (!) sets of single prints formed ahead of the European session, as the market was tagging the initial upside target at 6805 (UT1). Note, 6805 is also a level from the Weekly Plan. The auction then established a distribution above 6805 once Europe opened, a typically bullish development as the market built value and accepted above the level. However, the underlying structure was extremely poor, meaning that any signs of failure above 6805 had notable downside potential. Buyers ultimately failed to hold 6805, resulting in a significant liquidation break that not only retraced the overnight gains but also revisited Monday’s lows, breaking 6756 (DT1) in the process.
The RTH opened on a true gap down, and the key to monitor was fairly straightforward: could buyers reclaim 6756 to negate potential intraday weakness, and could they fill the gap at 6764? Failure to do so would obviously be a sign of weakness, keeping sellers in short-term control. Sellers stepped in at 6756 during the Initial Balance, and the failure to fill the gap led to sustained weakness. Downside momentum stalled at the next level of interest at 6720 (DT2), which, together with the pivotal VIX resistance level at 23.92, produced a couple of bounces. Change took place in the K-period, as sellers began gaining traction below 6720, forming single prints that led to a double distribution profile and a return within Friday’s value area.
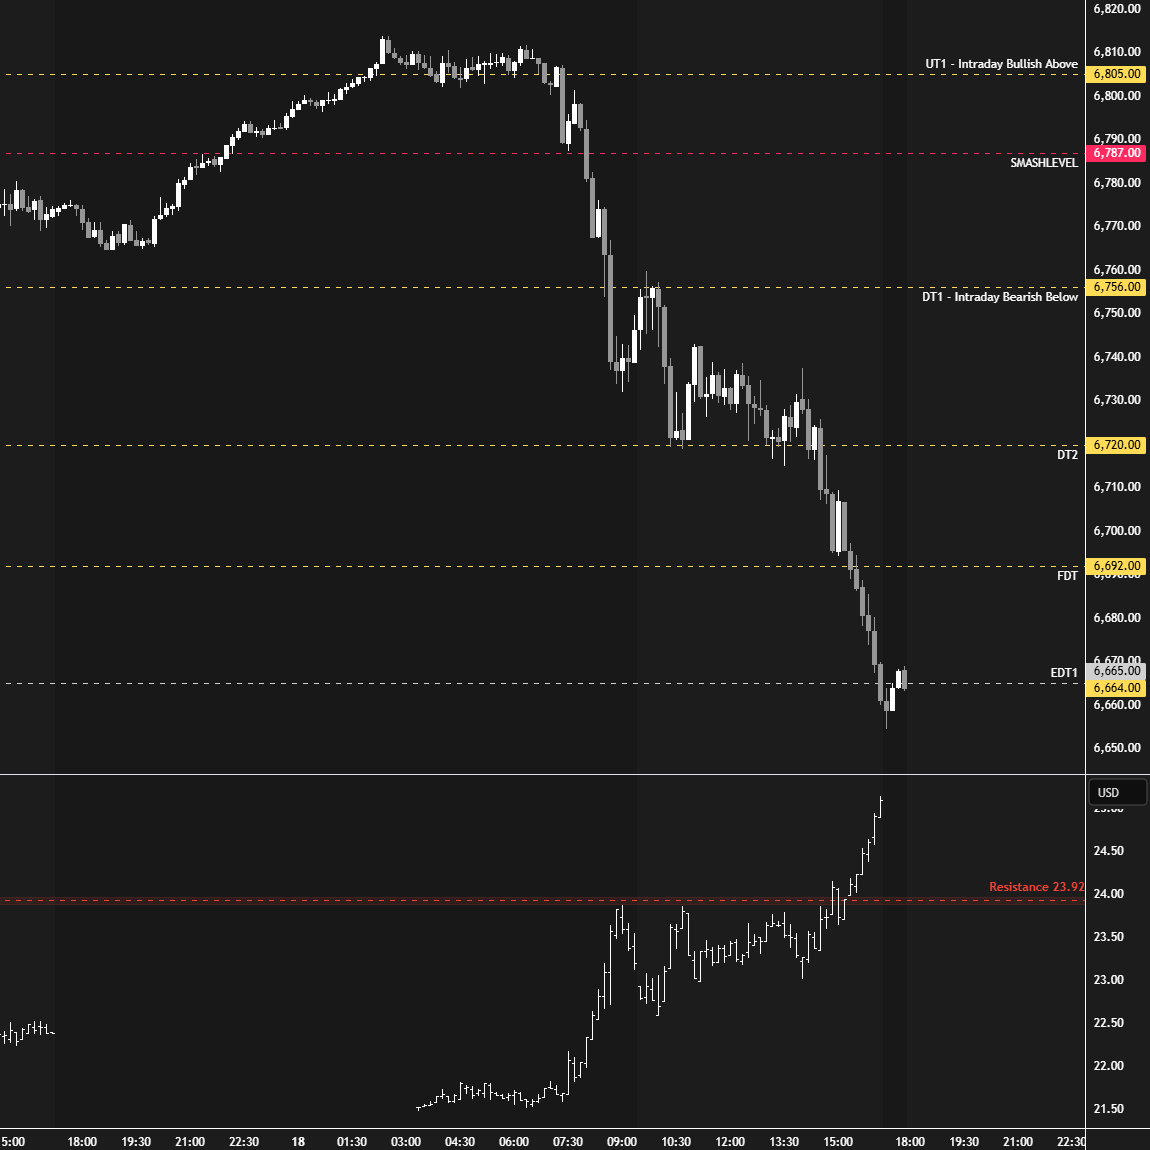
Today’s session formed a double distribution trend day to the downside, with one set of single prints in the K-period after opening on a true gap down, which ultimately failed to get filled (6764.25). So far, the auction is following last week’s script, with early strength followed by weakness. The key now is whether the weakness will be sustained. Intraday strength would be indicated by a reclaim of 6715 to negate today’s trend day, while weakness would be signaled by a break and hold of 6665.
In terms of levels, the Smashlevel is 6692, the HTF level. Holding below 6692 would target 6665 (DT1). Acceptance below 6665 would signal intraday weakness, targeting the roll gap at 6636 (DT2), with a final downside target at 6600 (FDT) under sustained selling pressure.
On the flip side, reclaiming and holding above 6692 would shift focus to today’s breakdown single prints at 6715 (UT1). Acceptance above 6715 would signal intraday strength, targeting the afternoon rally high at 6737 (UT2), with a final upside target at 6764 (FUT), the unfilled gap, under sustained buying pressure.
Levels of Interest
Going into tomorrow’s session, I’ll closely observe the behavior around 6692.
Break and hold above 6692 would target 6715 / 6737 / 6764
Holding below 6692 would target 6665 / 6636 / 6600
Additionally, pay attention to the following VIX levels: 26.72 and 23.46. These levels can provide confirmation of strength or weakness.
Break and hold above 6764 with VIX below 23.46 would confirm strength.
Break and hold below 6600 with VIX above 26.72 would confirm weakness.
Overall, it's important to exercise caution when trading outside of the highlighted yellow levels. A non-cooperative VIX may suggest possible reversals i.e trade setups.
This market is really teaching me a lot, thank you for being my guide under these circumstances.
Thanks smash!