ES Daily Plan | March 19, 2025
Key Levels & Market Context for the Upcoming Session.
For new followers: The yellow levels highlighted at the bottom left of the chart are the primary levels that I focus on intraday. My strategy for preventing impulsive decisions at unfavorable locations involves following a simple yet effective rule of exercising caution when initiating trades outside of the yellow levels. This implies that I am cautious chasing longs above the final yellow upside target and shorts below the final yellow downside target. It is crucial to understand that refraining from chasing a trade is not an automatic invitation to initiate a trade in the opposite direction.
Visual Representation
Contract Rollover
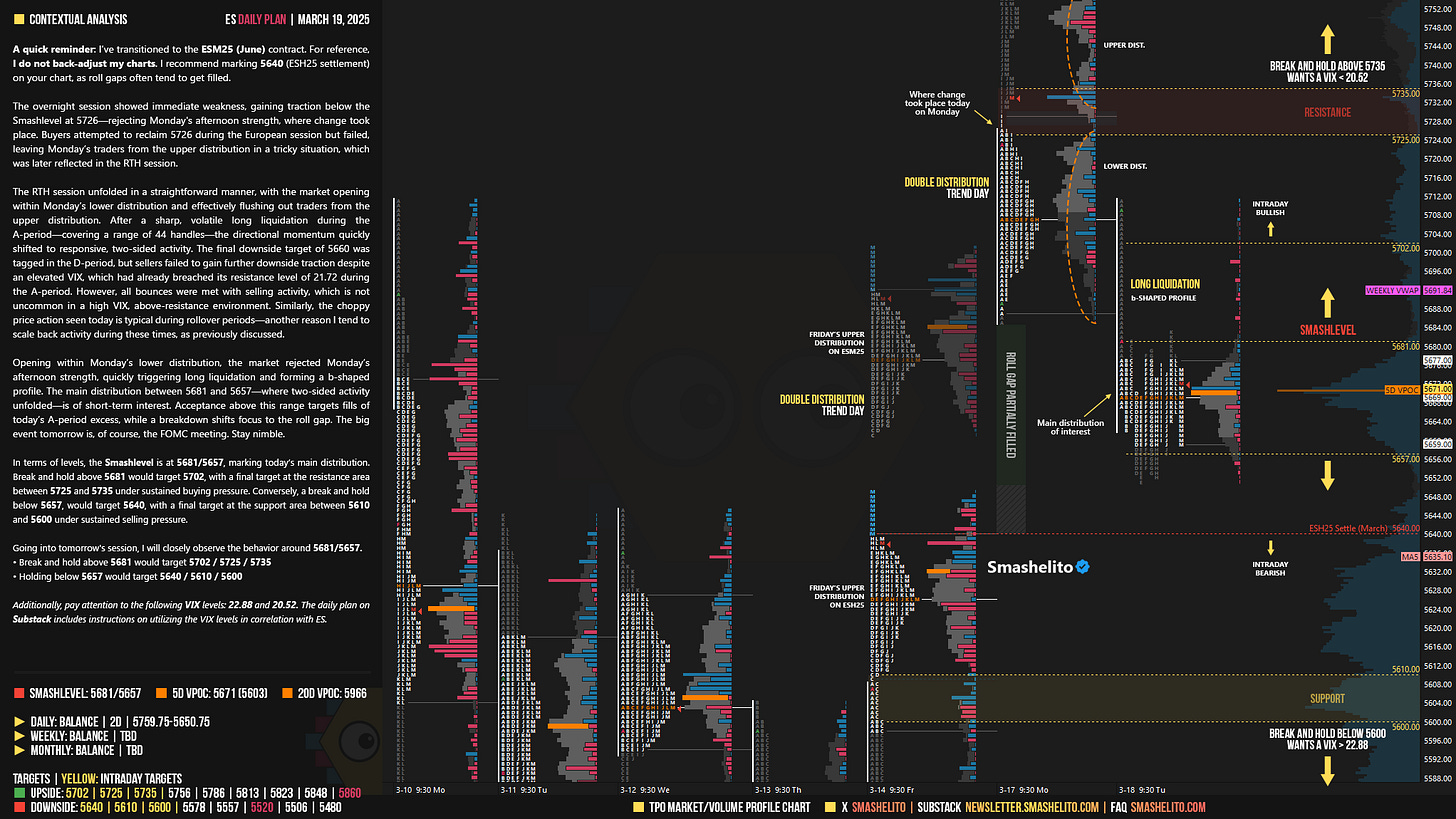
A quick reminder: I’ve transitioned to the ESM25 (June) contract. For reference, I do not back-adjust my charts. I recommend marking 5640 (ESH25 settlement) on your chart, as roll gaps often tend to get filled.
Contextual Analysis
The overnight session showed immediate weakness, gaining traction below the Smashlevel at 5726—rejecting Monday's afternoon strength, where change took place. Buyers attempted to reclaim 5726 during the European session but failed, leaving Monday’s traders from the upper distribution in a tricky situation, which was later reflected in the RTH session.
The RTH session unfolded in a straightforward manner, with the market opening within Monday’s lower distribution and effectively flushing out traders from the upper distribution. After a sharp, volatile long liquidation during the A-period—covering a range of 44 handles—the directional momentum quickly shifted to responsive, two-sided activity. The final downside target of 5660 was tagged in the D-period, but sellers failed to gain further downside traction despite an elevated VIX, which had already breached its resistance level of 21.72 during the A-period. However, all bounces were met with selling activity, which is not uncommon in a high VIX, above-resistance environment. Similarly, the choppy price action seen today is typical during rollover periods—another reason I tend to scale back activity during these times, as previously discussed.
Opening within Monday’s lower distribution, the market rejected Monday’s afternoon strength, quickly triggering long liquidation and forming a b-shaped profile. The main distribution between 5681 and 5657—where two-sided activity unfolded—is of short-term interest. Acceptance above this range targets fills of today’s A-period excess, while a breakdown shifts focus to the roll gap. The big event tomorrow is, of course, the FOMC meeting. Stay nimble.
In terms of levels, the Smashlevel is at 5681/5657, marking today’s main distribution. Break and hold above 5681 would target 5702, with a final target at the resistance area between 5725 and 5735 under sustained buying pressure. Conversely, a break and hold below 5657, would target 5640, with a final target at the support area between 5610 and 5600 under sustained selling pressure.
Levels of Interest
Going into tomorrow's session, I will closely observe the behavior around 5681/5657.
Break and hold above 5681 would target 5702 / 5725 / 5735
Holding below 5657 would target 5640 / 5610 / 5600
Additionally, pay attention to the following VIX levels: 22.88 and 20.52. These levels can provide confirmation of strength or weakness.
Break and hold above 5735 with VIX below 20.52 would confirm strength.
Break and hold below 5600 with VIX above 22.88 would confirm weakness.
Overall, it's important to exercise caution when trading outside of the highlighted yellow levels. A non-cooperative VIX may suggest possible reversals i.e trade setups.
Weekly Plan
Make sure to review the Weekly Plan, which provides a broader perspective and highlights key levels of interest to observe in the upcoming week.


Thanks Smash!
Danke Smash!