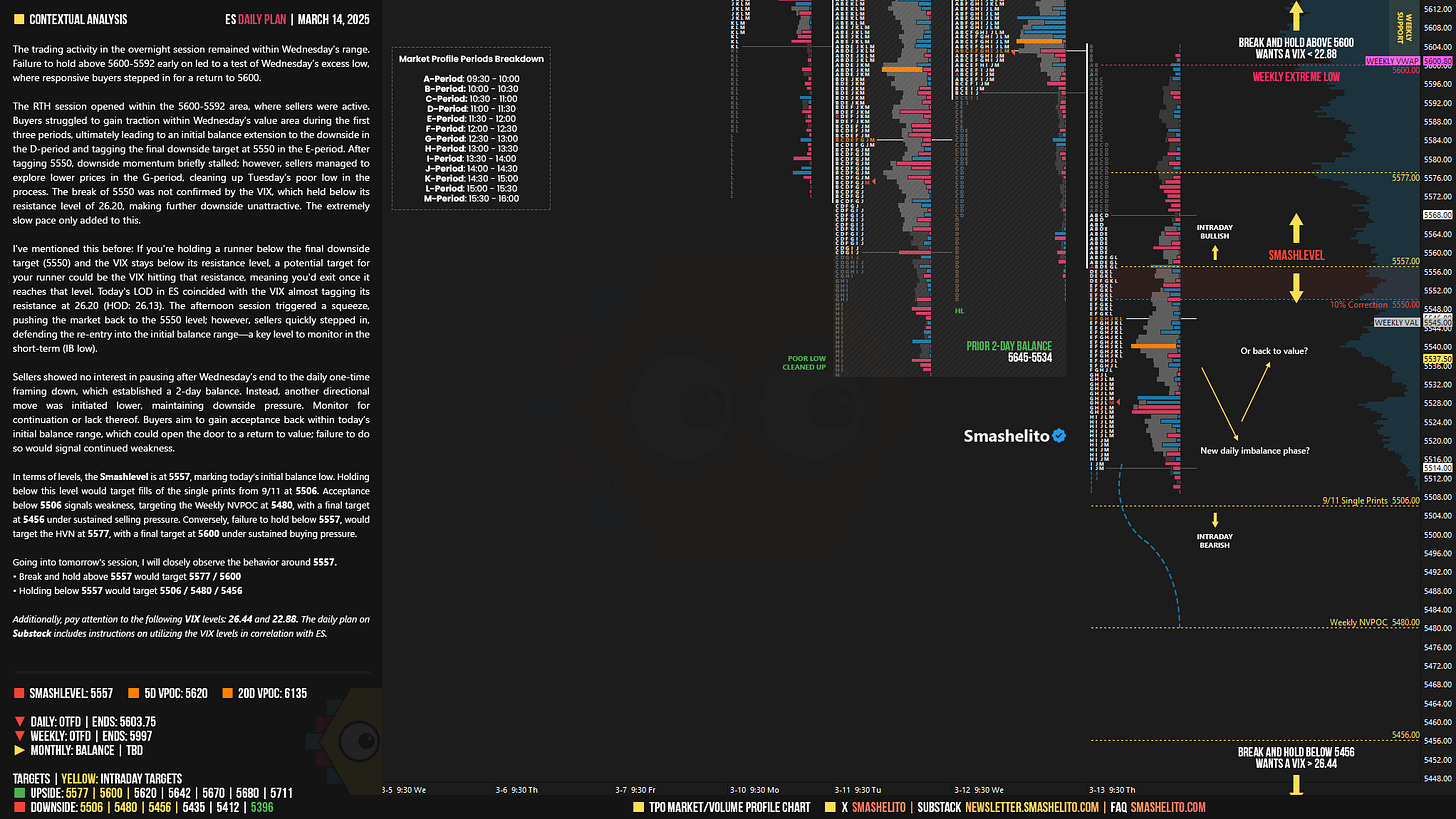
ES Daily Plan | March 14, 2025
Key Levels & Market Context for the Upcoming Session.
For new followers: The yellow levels highlighted at the bottom left of the chart are the primary levels that I focus on intraday. My strategy for preventing impulsive decisions at unfavorable locations involves following a simple yet effective rule of exercising caution when initiating trades outside of the yellow levels. This implies that I am cautious chasing longs above the final yellow upside target and shorts below the final yellow downside target. It is crucial to understand that refraining from chasing a trade is not an automatic invitation to initiate a trade in the opposite direction.
Visual Representation
Contextual Analysis
The trading activity in the overnight session remained within Wednesday’s range. Failure to hold above 5600-5592 early on led to a test of Wednesday’s excess low, where responsive buyers stepped in for a return to 5600.
The RTH session opened within the 5600-5592 area, where sellers were active. Buyers struggled to gain traction within Wednesday’s value area during the first three periods, ultimately leading to an initial balance extension to the downside in the D-period and tagging the final downside target at 5550 in the E-period. After tagging 5550, downside momentum briefly stalled; however, sellers managed to explore lower prices in the G-period, cleaning up Tuesday’s poor low in the process. The break of 5550 was not confirmed by the VIX, which held below its resistance level of 26.20, making further downside unattractive. The extremely slow pace only added to this.
I've mentioned this before: If you're holding a runner below the final downside target (5550) and the VIX stays below its resistance level, a potential target for your runner could be the VIX hitting that resistance, meaning you'd exit once it reaches that level. Today's LOD in ES coincided with the VIX almost tagging its resistance at 26.20 (HOD: 26.13). The afternoon session triggered a squeeze, pushing the market back to the 5550 level; however, sellers quickly stepped in, defending the re-entry into the initial balance range—a key level to monitor in the short-term (IB low).
Sellers showed no interest in pausing after Wednesday’s end to the daily one-time framing down, which established a 2-day balance. Instead, another directional move was initiated lower, maintaining downside pressure. Monitor for continuation or lack thereof. Buyers aim to gain acceptance back within today’s initial balance range, which could open the door to a return to value; failure to do so would signal continued weakness.
In terms of levels, the Smashlevel is at 5557, marking today’s initial balance low. Holding below this level would target fills of the single prints from 9/11 at 5506. Acceptance below 5506 signals weakness, targeting the Weekly NVPOC at 5480, with a final target at 5456 under sustained selling pressure. Conversely, failure to hold below 5557, would target the HVN at 5577, with a final target at 5600 under sustained buying pressure.
Levels of Interest
Going into tomorrow's session, I will closely observe the behavior around 5557.
Break and hold above 5557 would target 5577 / 5600
Holding below 5557 would target 5506 / 5480 / 5456
Additionally, pay attention to the following VIX levels: 26.44 and 22.88. These levels can provide confirmation of strength or weakness.
Break and hold above 5600 with VIX below 22.88 would confirm strength.
Break and hold below 5456 with VIX above 26.44 would confirm weakness.
Overall, it's important to exercise caution when trading outside of the highlighted yellow levels. A non-cooperative VIX may suggest possible reversals i.e trade setups.
Weekly Plan
Make sure to review the Weekly Plan, which provides a broader perspective and highlights key levels of interest to observe in the upcoming week.


Is the intraday bullish above level also 5557 or is it supposed to be 5577?
Thank you very much!