
ES Daily Plan | June 5, 2026
Market Context & Key Levels for the Day Ahead

— For new subscribers
The yellow levels highlighted at the bottom left of the chart are the primary intraday levels I focus on. To avoid impulsive decisions at poor trade locations, I follow a simple but effective rule: exercise caution when initiating trades outside of these yellow levels.
This means I’m cautious about chasing longs above the Final Upside Target (FUT) and shorts below the Final Downside Target (FDT). It’s important to understand that not chasing does not imply initiating a trade in the opposite direction, discipline over impulse.
Be sure to review the Weekly Plan for a broader perspective, key levels, and market expectations for the week ahead.

Contextual Analysis & Plan
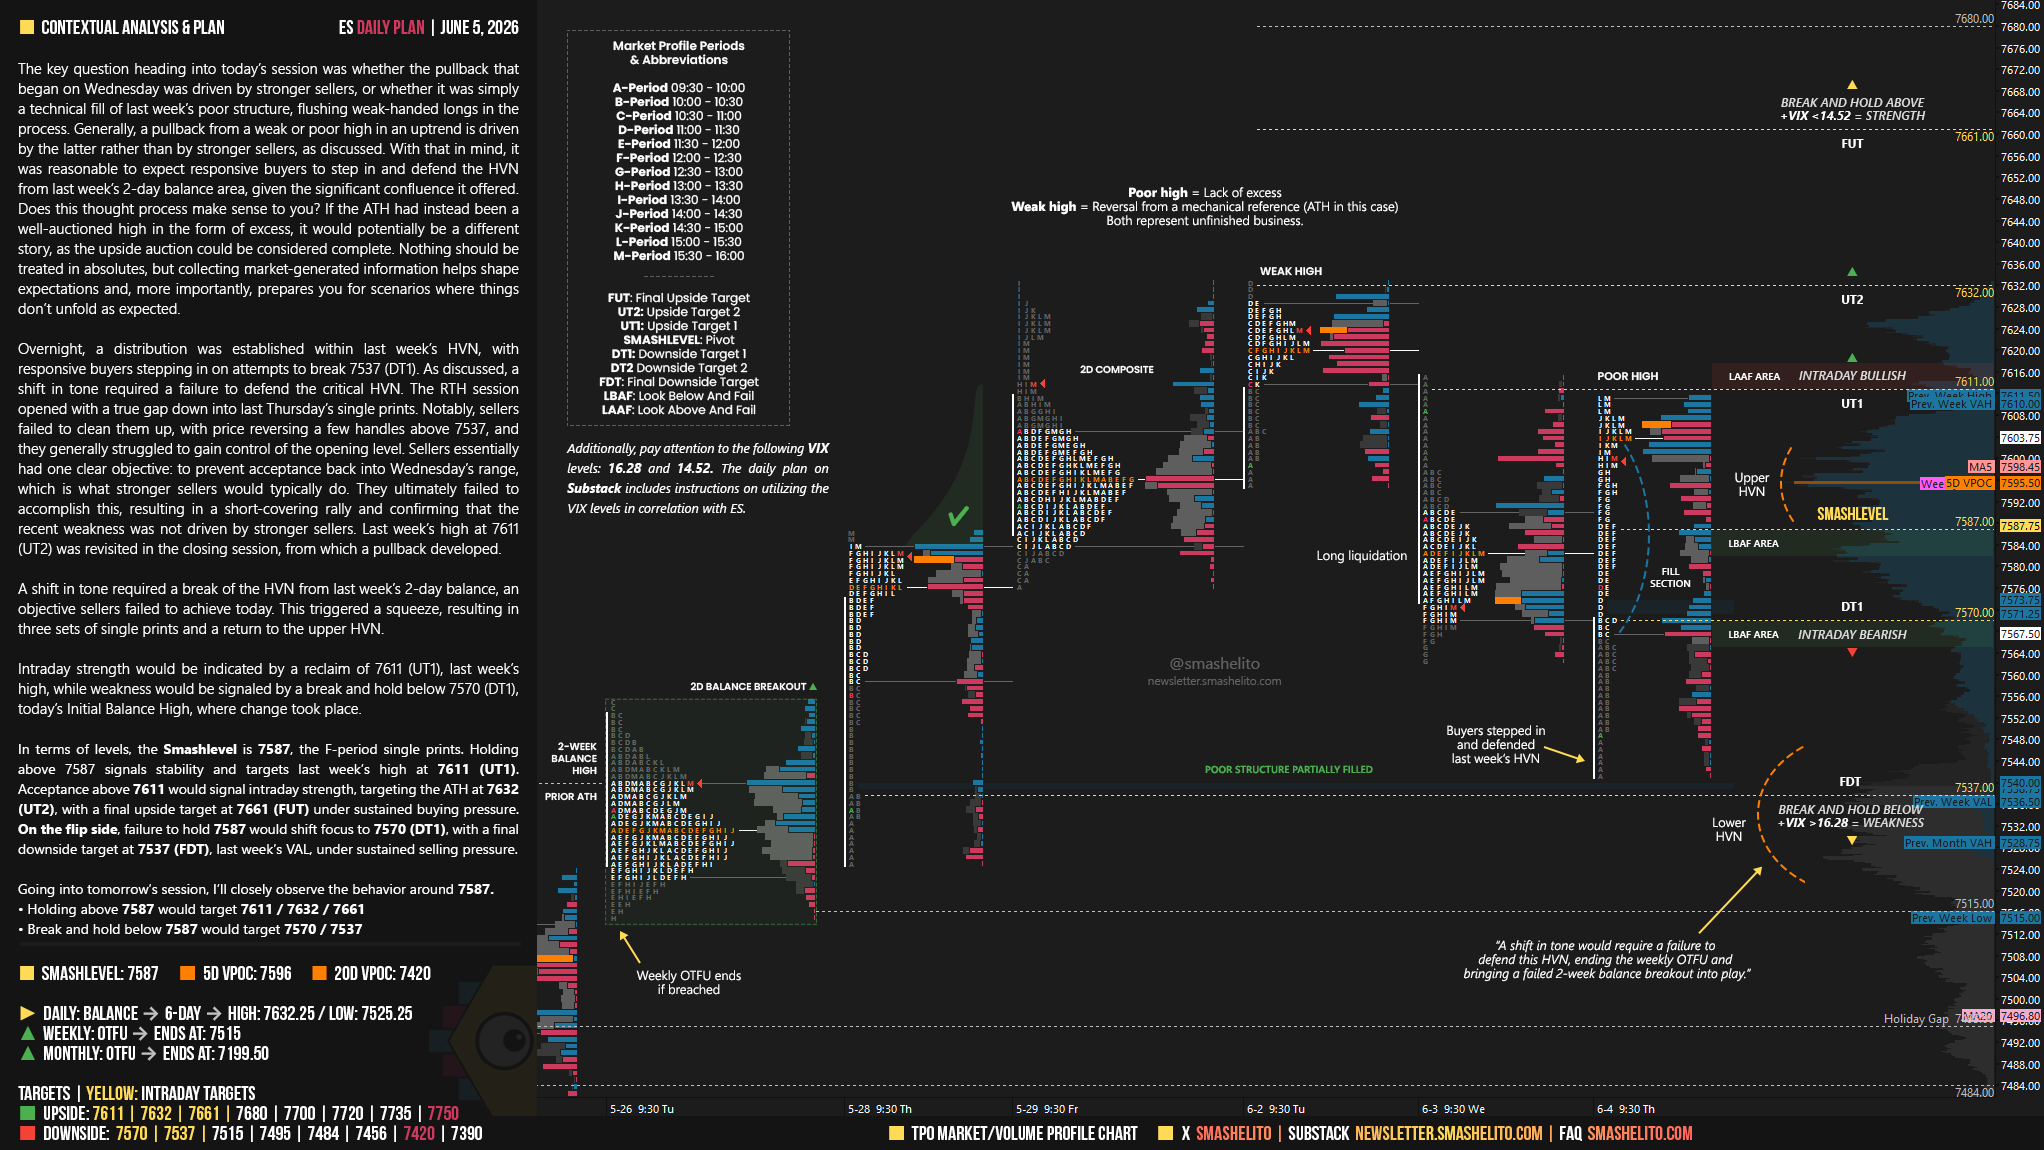
The key question heading into today’s session was whether the pullback that began on Wednesday was driven by stronger sellers, or whether it was simply a technical fill of last week’s poor structure, flushing weak-handed longs in the process. Generally, a pullback from a weak or poor high in an uptrend is driven by the latter rather than by stronger sellers, as discussed. With that in mind, it was reasonable to expect responsive buyers to step in and defend the HVN from last week’s 2-day balance area, given the significant confluence it offered. Does this thought process make sense to you?
If the ATH had instead been a well-auctioned high in the form of excess, it would potentially be a different story, as the upside auction could be considered complete. Nothing should be treated in absolutes, but collecting market-generated information helps shape expectations and, more importantly, prepares you for scenarios where things don’t unfold as expected.
Overnight, a distribution was established within last week’s HVN, with responsive buyers stepping in on attempts to break 7537 (DT1). As discussed, a shift in tone required a failure to defend the critical HVN. The RTH session opened with a true gap down into last Thursday’s single prints. Notably, sellers failed to clean them up, with price reversing a few handles above 7537, and they generally struggled to gain control of the opening level.
Sellers essentially had one clear objective: to prevent acceptance back into Wednesday’s range, which is what stronger sellers would typically do. They ultimately failed to accomplish this, resulting in a short-covering rally and confirming that the recent weakness was not driven by stronger sellers. Last week’s high at 7611 (UT2) was revisited in the closing session, from which a pullback developed.
Smashlevels Recap
A shift in tone required a break of the HVN from last week’s 2-day balance, an objective sellers failed to achieve today. This triggered a squeeze, resulting in three sets of single prints and a return to the upper HVN.
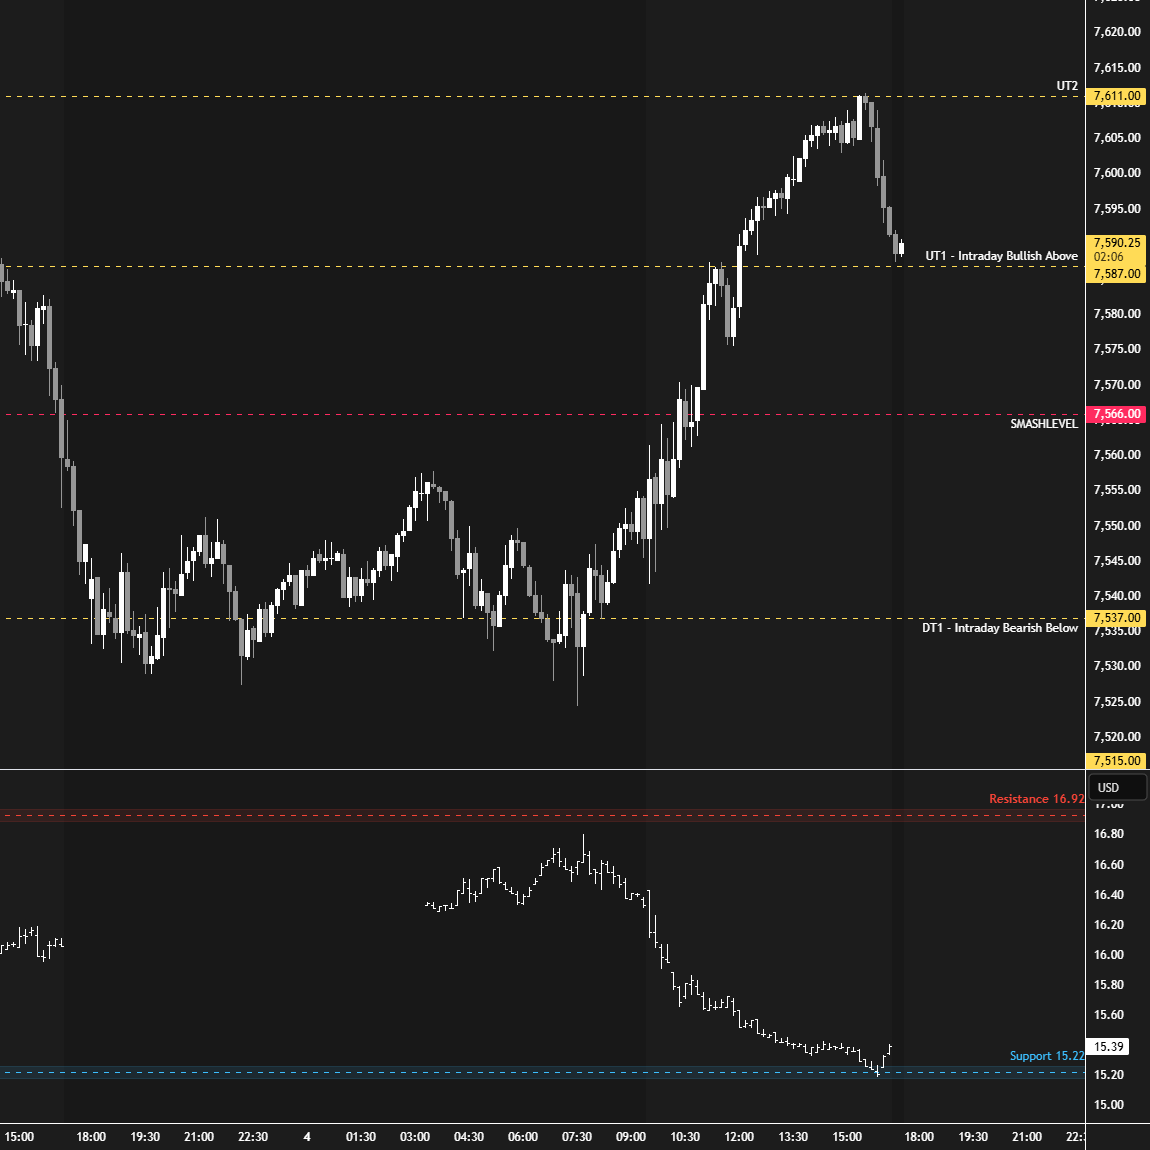
Intraday strength would be indicated by a reclaim of 7611 (UT1), last week’s high, while weakness would be signaled by a break and hold below 7570 (DT1), today’s Initial Balance high, where change took place.
In terms of levels, the Smashlevel is 7587, the F-period single prints. Holding above 7587 signals stability and targets last week’s high at 7611 (UT1). Acceptance above 7611 would signal intraday strength, targeting the ATH at 7632 (UT2), with a final upside target at 7661 (FUT) under sustained buying pressure.
On the flip side, failure to hold 7587 would shift focus to 7570 (DT1), with a final downside target at 7537 (FDT), last week’s VAL, under sustained selling pressure.
Visual Representation
Levels of Interest
Going into tomorrow’s session, I’ll closely observe the behavior around 7587.
Holding above 7587 would target 7611 / 7632 / 7661
Break and hold below 7587 would target 7570 / 7537
Additionally, pay attention to the following VIX levels: 16.28 and 14.52. These levels can provide confirmation of strength or weakness.
Break and hold above 7661 with VIX below 14.52 would confirm strength.
Break and hold below 7537 with VIX above 16.28 would confirm weakness.
Overall, it's important to exercise caution when trading outside of the highlighted yellow levels. A non-cooperative VIX may suggest possible reversals i.e trade setups.
Smashelito es un angelito
Great write-up, Smash! The structural confluence at your 7587 level is absolute gold.
While I track in one-tick increments and mapped four distinct distributions today, that exact price sits perfectly in the pocket between the second and third distribution edges.
The bulls managed to shift the MGI in their favor today, and I completely agree with your perspective... watching how price reacts at that specific line will tell us everything we need to know about who truly controls the auction. Appreciate the insights! You are just the best!