
ES Daily Plan | June 4, 2026
Market Context & Key Levels for the Day Ahead

— For new subscribers
The yellow levels highlighted at the bottom left of the chart are the primary intraday levels I focus on. To avoid impulsive decisions at poor trade locations, I follow a simple but effective rule: exercise caution when initiating trades outside of these yellow levels.
This means I’m cautious about chasing longs above the Final Upside Target (FUT) and shorts below the Final Downside Target (FDT). It’s important to understand that not chasing does not imply initiating a trade in the opposite direction, discipline over impulse.
Be sure to review the Weekly Plan for a broader perspective, key levels, and market expectations for the week ahead.

Contextual Analysis & Plan
The overnight session was rather uneventful aside from an early news-driven liquidation break that was instantly retraced. The tone shifted ahead of the RTH open, as sellers broke 7615 (Smashlevel), Tuesday’s afternoon pullback low, putting Tuesday’s inventory above the Initial Balance range under pressure.
Heading into RTH, the immediate focus was on 7615, where we had additional confluence from the FS VWAP, with last week’s high at 7611 closely aligned as well. The key question was whether sellers could step in and defend the level, keeping Tuesday’s inventory trapped. Failure to do so would indicate that little had changed contextually. During the A-period, 7615 was tested, quickly finding sellers and triggering weakness (see Figure 1). This sequence marked the HOD.
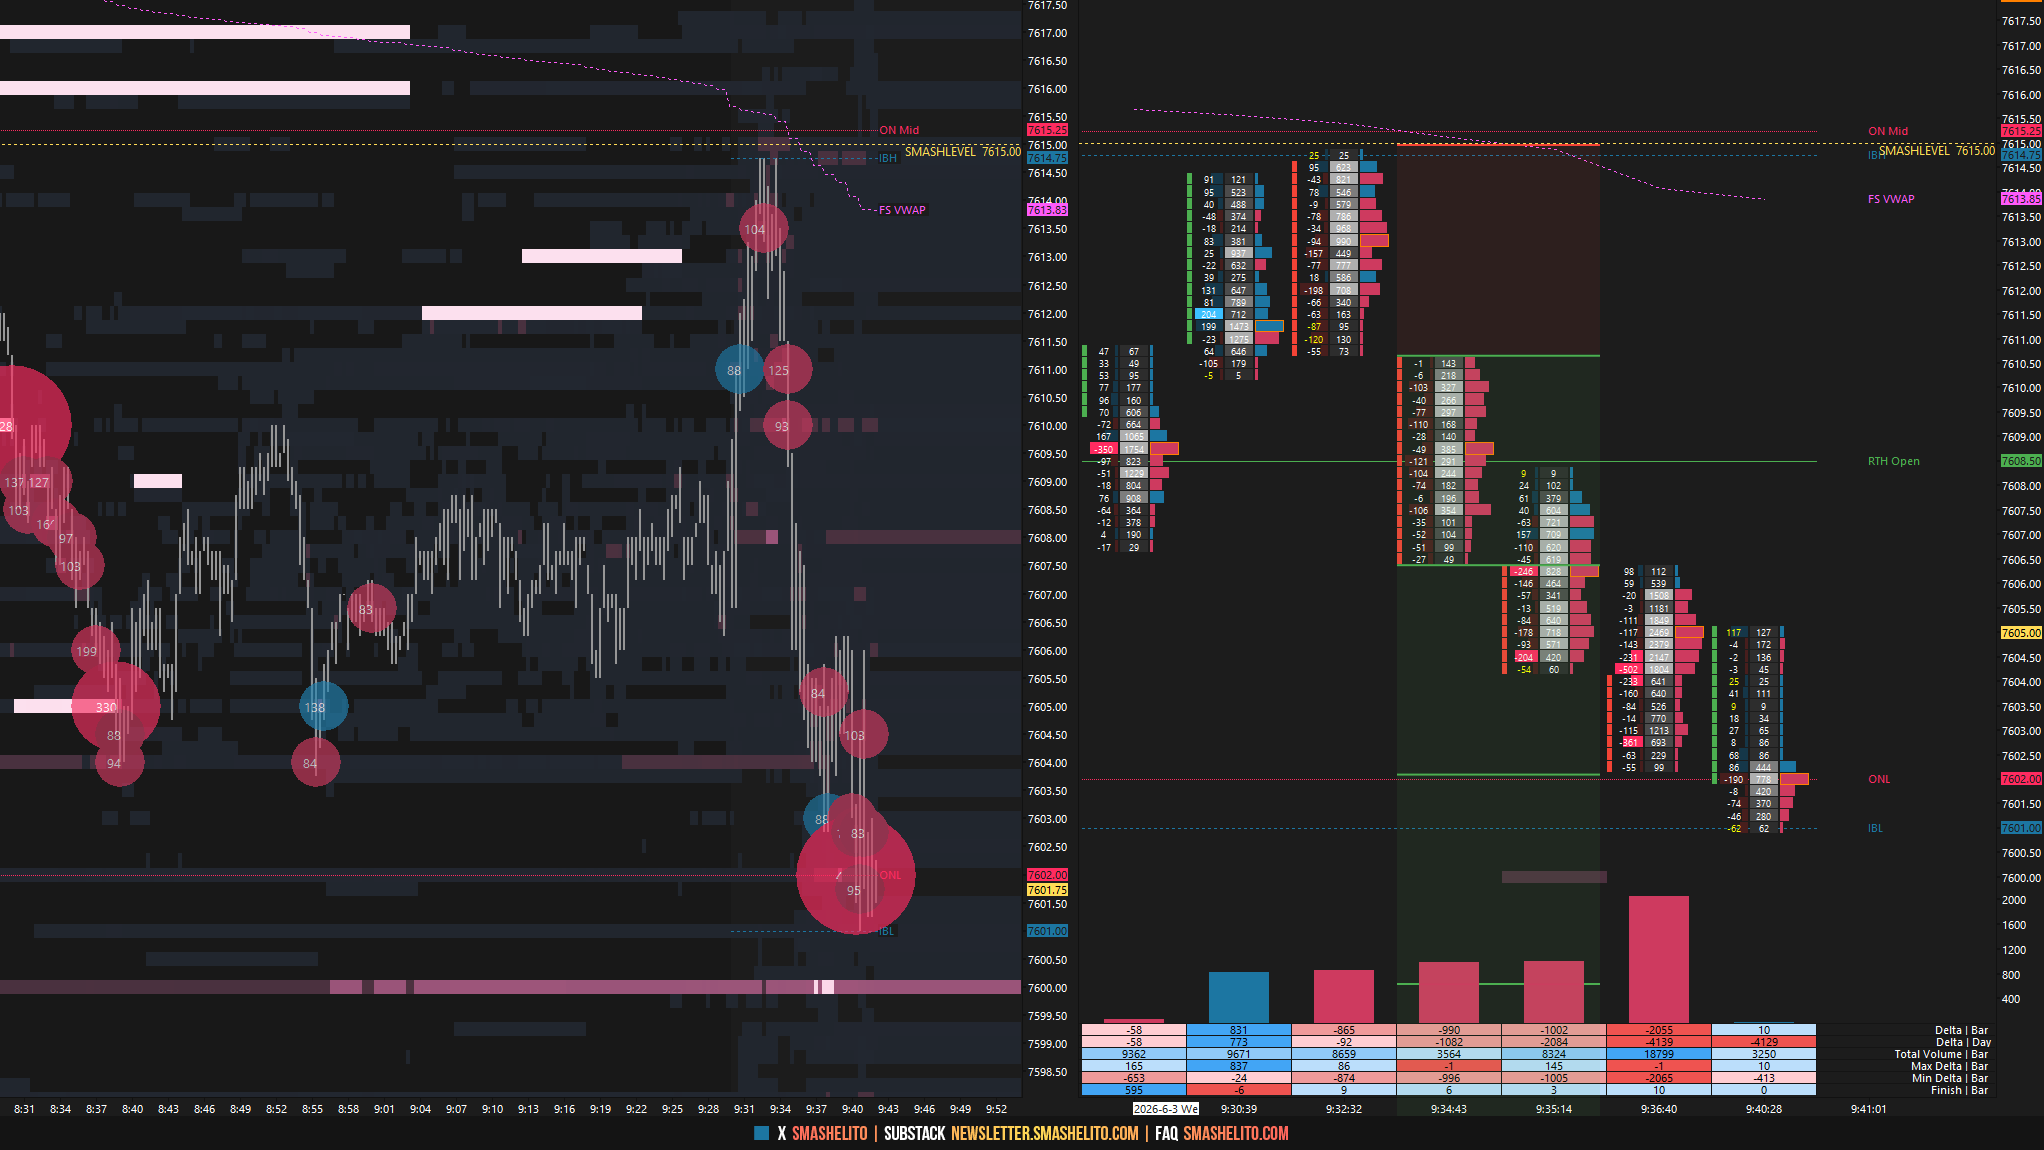
While buyers managed to reclaim 7585 (DT1) in the B-period, they ultimately struggled to gain traction within Tuesday’s range, forming a poor high in the C-period and leading to further downside pressure. The final downside target at 7562 (FDT) was tagged within two ticks during the G-period, from which a reversal unfolded. Always exercise caution when chasing FUT/FDT levels, especially when hit counter to the prevailing trend. In the afternoon session, the key level for buyers to reclaim was 7585 to negate the intraday bearish tone; however, 7585 instead acted as the afternoon rally high, triggering another leg to the downside.
Smashlevels Recap
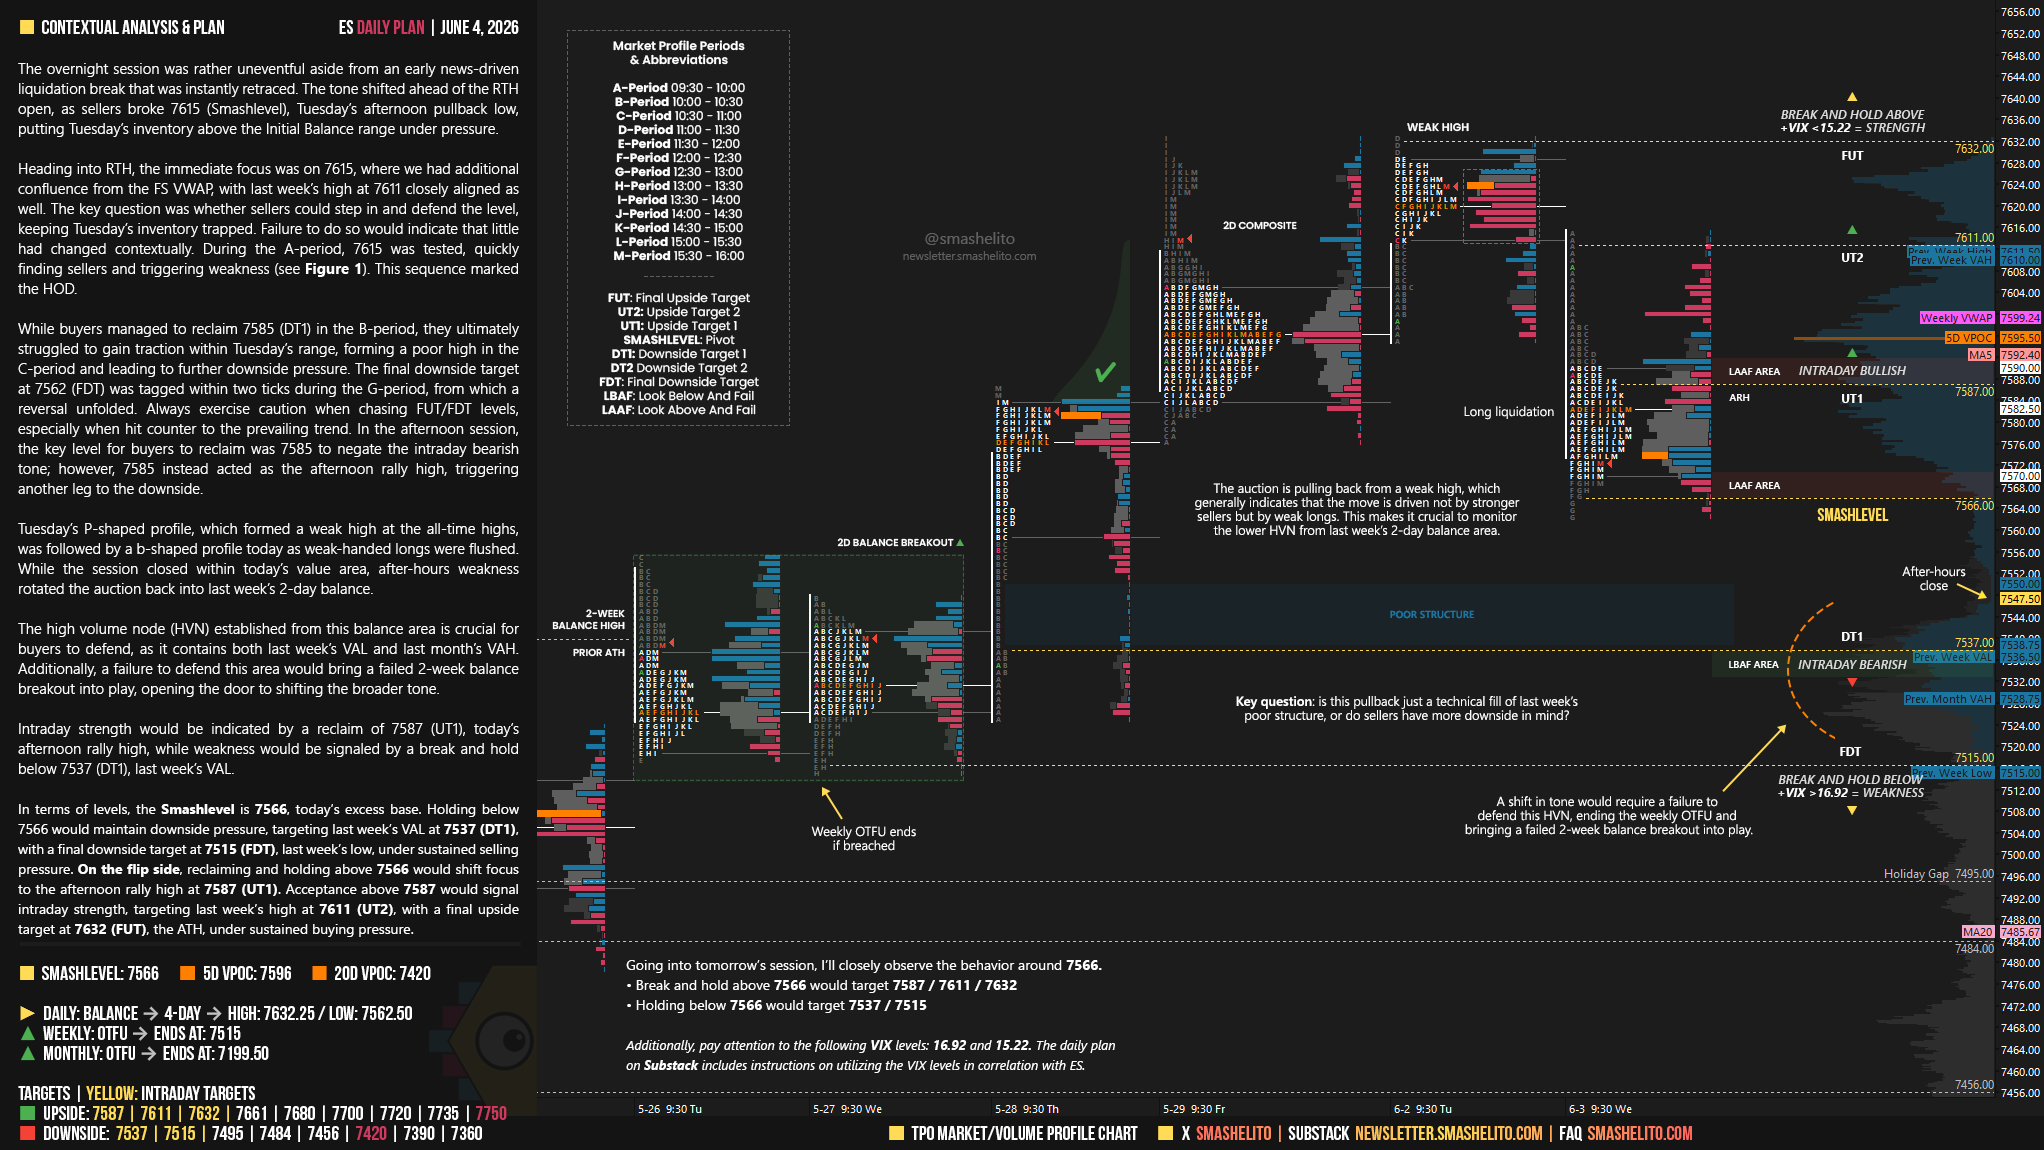
Tuesday’s P-shaped profile, which formed a weak high at the all-time highs, was followed by a b-shaped profile today as weak-handed longs were flushed. While the session closed within today’s value area, after-hours weakness rotated the auction back into last week’s 2-day balance.
The high volume node (HVN) established from this balance area is crucial for buyers to defend, as it contains both last week’s VAL and last month’s VAH. Additionally, a failure to defend this area would bring a failed 2-week balance breakout into play, opening the door to shifting the broader tone.
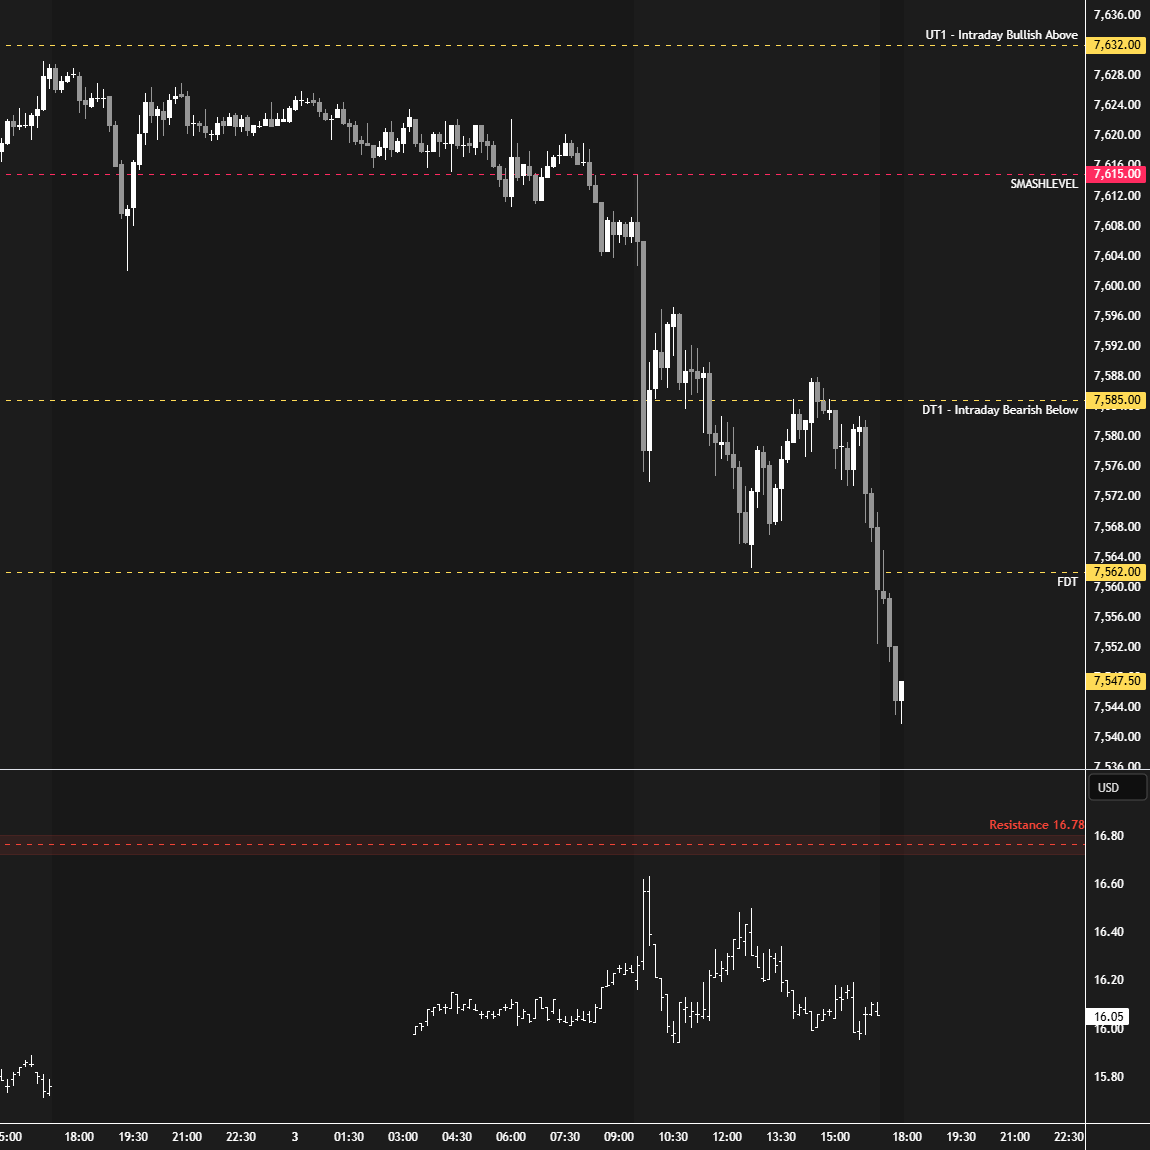
Intraday strength would be indicated by a reclaim of 7587 (UT1), today’s afternoon rally high, while weakness would be signaled by a break and hold below 7537 (DT1), last week’s VAL.
In terms of levels, the Smashlevel is 7566, today’s excess base. Holding below 7566 would maintain downside pressure, targeting last week’s VAL at 7537 (DT1), with a final downside target at 7515 (FDT), last week’s low, under sustained selling pressure.
On the flip side, reclaiming and holding above 7566 would shift focus to the afternoon rally high at 7587 (UT1). Acceptance above 7587 would signal intraday strength, targeting last week’s high at 7611 (UT2), with a final upside target at 7632 (FUT), the ATH, under sustained buying pressure.
Visual Representation
Levels of Interest
Going into tomorrow’s session, I’ll closely observe the behavior around 7566.
Break and hold above 7566 would target 7587 / 7611 / 7632
Holding below 7566 would target 7537 / 7515
Additionally, pay attention to the following VIX levels: 16.92 and 15.22. These levels can provide confirmation of strength or weakness.
Break and hold above 7632 with VIX below 15.22 would confirm strength.
Break and hold below 7515 with VIX above 16.92 would confirm weakness.
Overall, it's important to exercise caution when trading outside of the highlighted yellow levels. A non-cooperative VIX may suggest possible reversals i.e trade setups.
Amazing content! Thank you Smash!
Thanks Smash. Appreciated as always.