ES Daily Plan | June 4, 2025
Recap, Market Context & Key Levels for the Day Ahead
— For new subscribers
The yellow levels highlighted at the bottom left of the chart are the primary intraday levels I focus on. To avoid impulsive decisions at poor trade locations, I follow a simple but effective rule: exercise caution when initiating trades outside of these yellow levels.
This means I’m cautious about chasing longs above the Final Upside Target (FUT) and shorts below the Final Downside Target (FDT). It’s important to understand that not chasing does not imply initiating a trade in the opposite direction — discipline over impulse.
Be sure to review the ES Weekly Plan | June 2-6, 2025 for a broader perspective, key levels, and market expectations for the week ahead.
Contextual Analysis & Plan
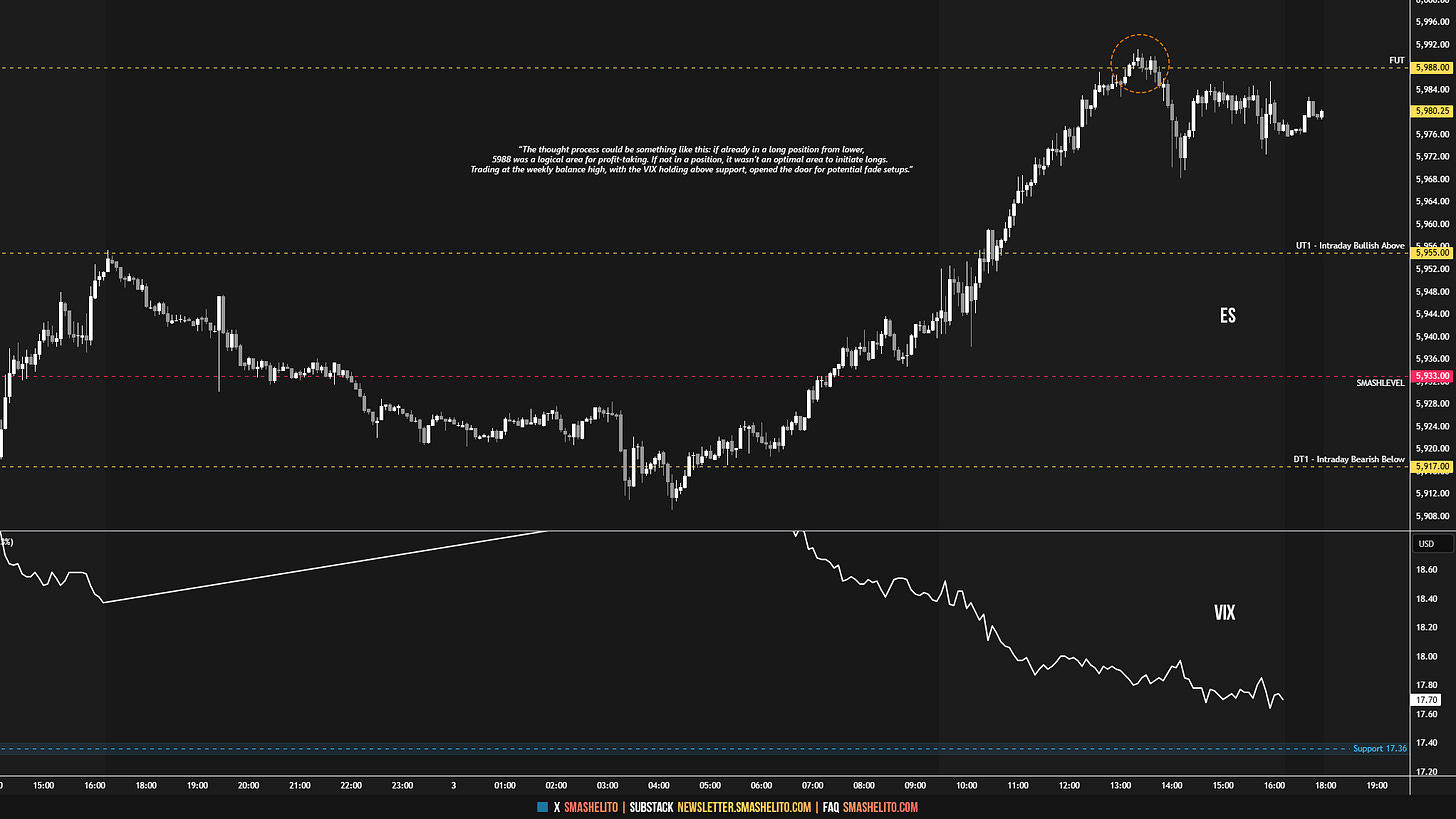
Monday’s closing strength led to the formation of a double distribution profile, coming just a few handles shy of testing the inside week high at 5955 (UT1)—a level that was tagged in after-hours trading, where sellers were waiting. The rotation lower continued in the overnight session, leading to a test of the Smashlevel at 5933, which initially provided a bounce. The reason for using 5933 as a pivot was simply due to the presence of trapped sellers within Monday’s J-period single prints, making it reasonable to monitor that area for responsive buyers if tested. Buyers defended 5933 for a couple of hours before it ultimately broke. A failure to hold within Monday’s upper distribution opened the door for a rotation back toward the high volume node at 5917 (DT1), as discussed—which was reached a couple of hours later. A break and hold below 5917 (DT1) would have been considered intraday bearish—something sellers ultimately failed to accomplish, as the market returned within Monday’s upper distribution ahead of the RTH open.
The RTH session was characterized by strong directional conviction, to say the least. Trading during the initial balance (IB) took place at the upper end of the inside week range. Once the C-period extended beyond both the IB and the inside week high, the market never looked back. Reclaiming 5955 (UT1)—initiating an inside week breakout—targeted the 3-week balance high at 5988 (FUT), which was tagged during the H-period. However, reaching the weekly balance high after rallying from the 5917 HVN without meaningful pullbacks wasn’t the most favorable setup for a sustained weekly breakout, given the potential lack of energy. This, combined with the fact that the VIX held above its support level at 17.36 while ES tagged the final upside target (5988), made a breakout even less appealing to chase (see Figure 1). The thought process could be something like this: if already in a long position from lower, 5988 was a logical area for profit-taking. If not in a position, it wasn’t an optimal area to initiate longs. Trading at the weekly balance high, with the VIX holding above support, opened the door for potential fade setups. From an order flow perspective, aggressive selling notably started to hit the tape around the 5988 level (see Figure 2). This alignment between market context and real-time order flow highlights the value of combining both to identify high-quality trade opportunities. The J-period then saw a notable liquidation break, which buyers ultimately were quick to absorb.
Today’s double distribution resulted in an inside week breakout, quickly leading to a test of the 3-week balance high at 5988—the short-term inflection point to monitor going forward. As the market attempts to explore prices away from value, the most bullish response would involve reclaiming 5988, setting the stage for a phase of imbalance. A less bullish outcome would involve consolidation within today’s upper distribution, building energy for a potential breakout. A return within today’s initial balance, however, would open the door for a rotation back toward the HVN at 5917.
In terms of levels, the Smashlevel is at 5988. Holding below 5988 would target fills of poor structure toward the support area between 5968 and 5960 (DT1). Acceptance below 5960 signals weakness, targeting the support area between 5927 and 5917 (FDT)—the HVN.
On the flip side, reclaiming and holding above 5988 would target 6014 (UT1), with a final upside target (FUT) at 6034 under sustained buying pressure.
Levels of Interest
Going into tomorrow’s session, I’ll closely observe the behavior around 5988.
Break and hold above 5988 would target 6014 / 6034
Holding below 5988 would target 5968-60 / 5927-17
Additionally, pay attention to the following VIX levels: 18.62 and 16.74. These levels can provide confirmation of strength or weakness.
Break and hold above 6034 with VIX below 16.74 would confirm strength.
Break and hold below 5917 with VIX above 18.62 would confirm weakness.
Overall, it's important to exercise caution when trading outside of the highlighted yellow levels. A non-cooperative VIX may suggest possible reversals i.e trade setups.


Great stuff as always Smash!
Thank you Smash! Yesterday's session was made straightforward with your fantastic work!