
ES Daily Plan | June 3, 2025
Market Context & Key Levels for the Day Ahead

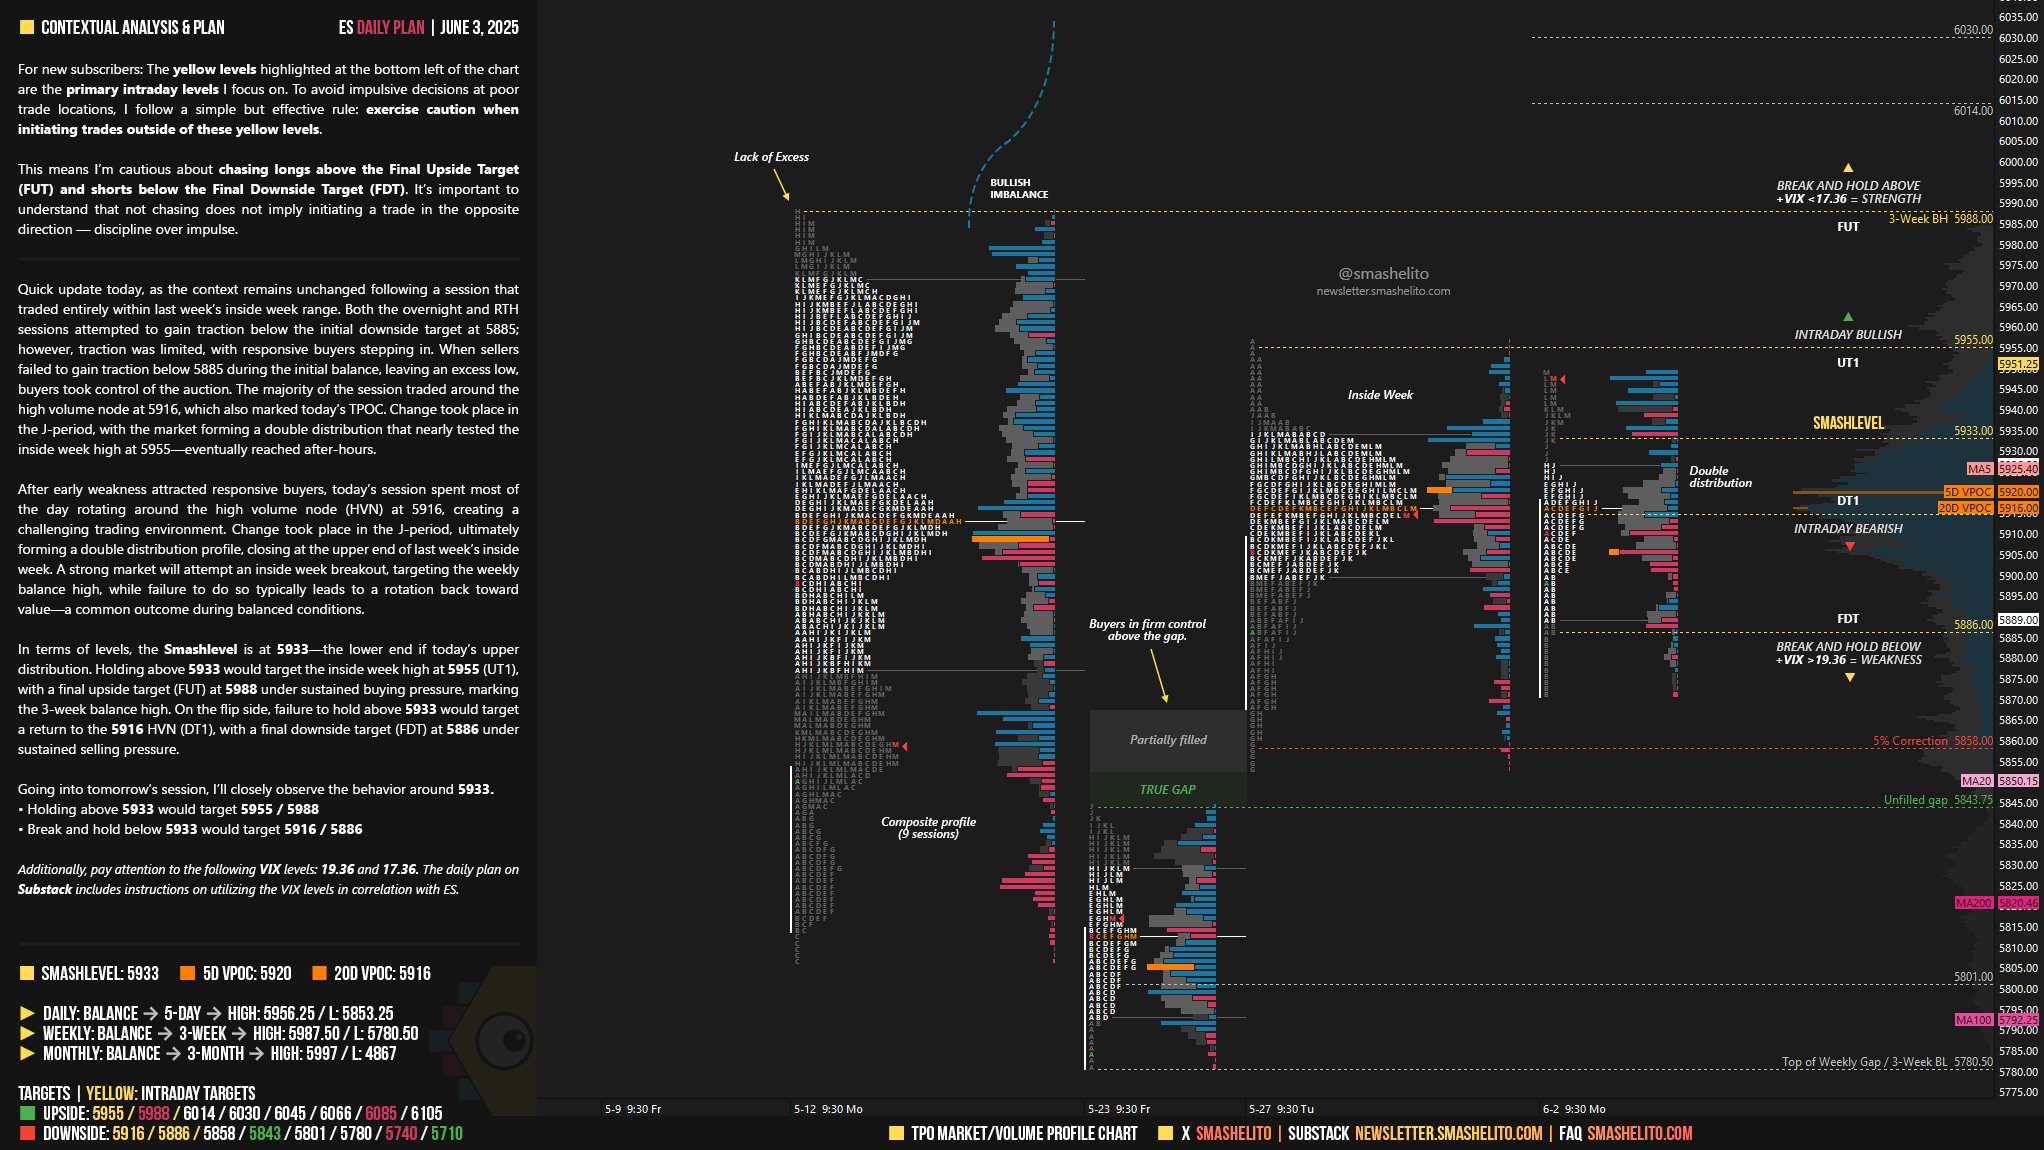
— For new subscribers
The yellow levels highlighted at the bottom left of the chart are the primary intraday levels I focus on. To avoid impulsive decisions at poor trade locations, I follow a simple but effective rule: exercise caution when initiating trades outside of these yellow levels.
This means I’m cautious about chasing longs above the Final Upside Target (FUT) and shorts below the Final Downside Target (FDT). It’s important to understand that not chasing does not imply initiating a trade in the opposite direction — discipline over impulse.
Be sure to review the ES Weekly Plan | June 2-6, 2025 for a broader perspective, key levels, and market expectations for the week ahead.
Contextual Analysis & Plan
When the market is in balance, we use the balance guidelines as a framework to form trade hypotheses based on how price behaves around that balance area. This is discussed in greater detail in the Weekly Plan, which is worth checking out.
Quick update today, as the context remains unchanged following a session that traded entirely within last week’s inside week range. Both the overnight and RTH sessions attempted to gain traction below the initial downside target at 5885; however, traction was limited, with responsive buyers stepping in. When sellers failed to gain traction below 5885 during the initial balance, leaving an excess low, buyers took control of the auction. The majority of the session traded around the high volume node at 5916, which also marked today’s TPOC. Change took place in the J-period, with the market forming a double distribution that nearly tested the inside week high at 5955—eventually reached after-hours.
After early weakness attracted responsive buyers, today’s session spent most of the day rotating around the high volume node (HVN) at 5916, creating a challenging trading environment. Change took place in the J-period, ultimately forming a double distribution profile, closing at the upper end of last week’s inside week. A strong market will attempt an inside week breakout, targeting the weekly balance high, while failure to do so typically leads to a rotation back toward value—a common outcome during balanced conditions.
In terms of levels, the Smashlevel is at 5933—the lower end if today’s upper distribution. Holding above 5933 would target the inside week high at 5955 (UT1), with a final upside target (FUT) at 5988 under sustained buying pressure, marking the 3-week balance high.
On the flip side, failure to hold above 5933 would target a return to the 5916 HVN (DT1), with a final downside target (FDT) at 5886 under sustained selling pressure.
Levels of Interest
Going into tomorrow’s session, I’ll closely observe the behavior around 5933.
Holding above 5933 would target 5955 / 5988
Break and hold below 5933 would target 5916 / 5886
Additionally, pay attention to the following VIX levels: 19.36 and 17.36. These levels can provide confirmation of strength or weakness.
Break and hold above 5988 with VIX below 17.36 would confirm strength.
Break and hold below 5886 with VIX above 19.36 would confirm weakness.
Overall, it's important to exercise caution when trading outside of the highlighted yellow levels. A non-cooperative VIX may suggest possible reversals i.e trade setups.
Thanks Smash!
Nice, thanks!