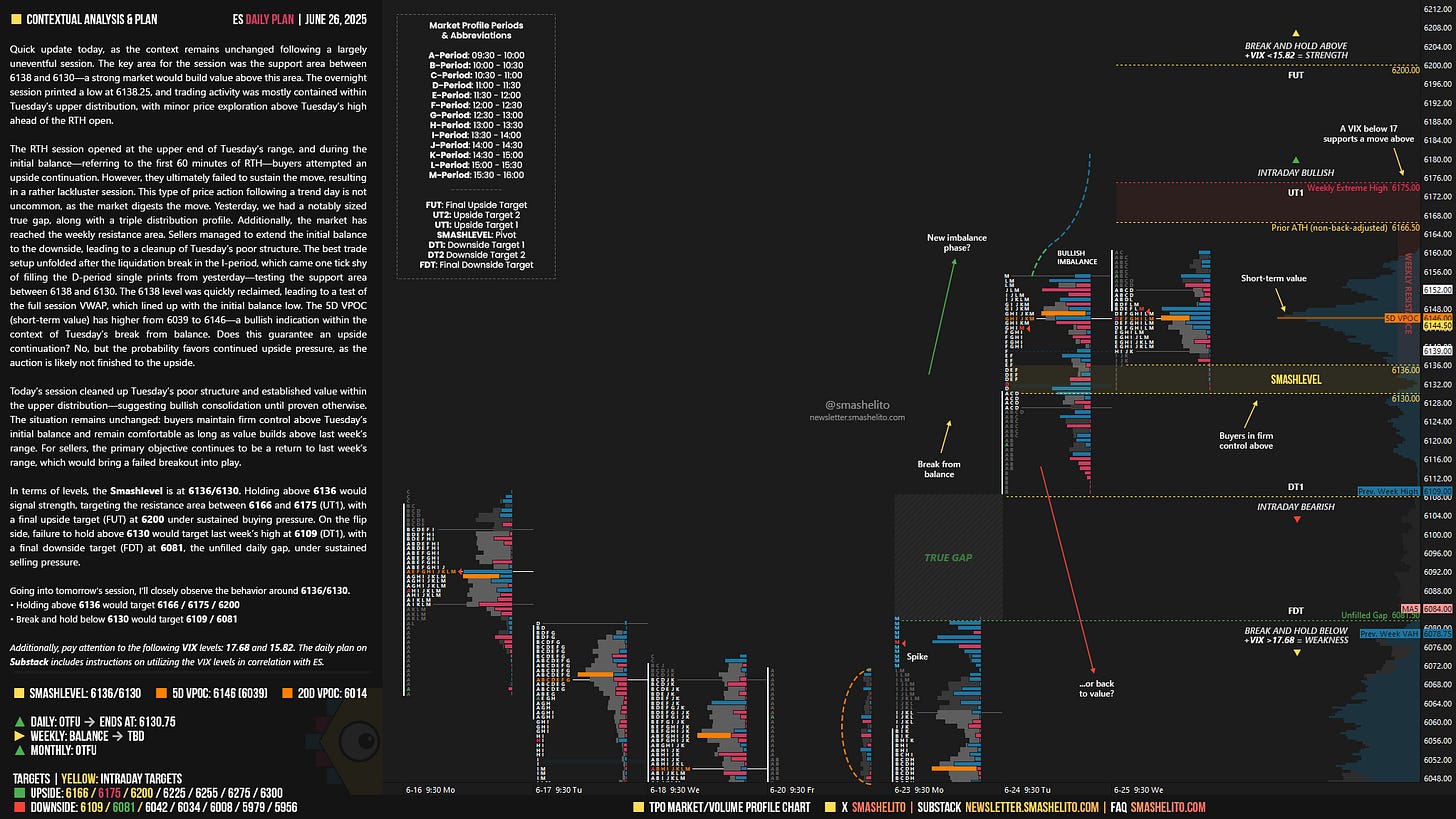
ES Daily Plan | June 26, 2025
Recap, Market Context & Key Levels for the Day Ahead
— For new subscribers
The yellow levels highlighted at the bottom left of the chart are the primary intraday levels I focus on. To avoid impulsive decisions at poor trade locations, I follow a simple but effective rule: exercise caution when initiating trades outside of these yellow levels.
This means I’m cautious about chasing longs above the Final Upside Target (FUT) and shorts below the Final Downside Target (FDT). It’s important to understand that not chasing does not imply initiating a trade in the opposite direction — discipline over impulse.
Be sure to review the ES Weekly Plan | June 23-27, 2025 for a broader perspective, key levels, and market expectations for the week ahead.
Contextual Analysis & Plan
Quick update today, as the context remains unchanged following a largely uneventful session. The key area for the session was the support area between 6138 and 6130—a strong market would build value above this area. The overnight session printed a low at 6138.25, and trading activity was mostly contained within Tuesday’s upper distribution, with minor price exploration above Tuesday’s high ahead of the RTH open.
The RTH session opened at the upper end of Tuesday’s range, and during the initial balance—referring to the first 60 minutes of RTH—buyers attempted an upside continuation. However, they ultimately failed to sustain the move, resulting in a rather lackluster session. This type of price action following a trend day is not uncommon, as the market digests the move. Yesterday, we had a notably sized true gap, along with a triple distribution profile. Additionally, the market has reached the weekly resistance area. Sellers managed to extend the initial balance to the downside, leading to a cleanup of Tuesday’s poor structure. The best trade setup unfolded after the liquidation break in the I-period, which came one tick shy of filling the D-period single prints from yesterday—testing the support area between 6138 and 6130 (see Figure 1). The 6138 level was quickly reclaimed, leading to a test of the full session VWAP, which lined up with the initial balance low.
The 5D VPOC (short-term value) has higher from 6039 to 6146—a bullish indication within the context of Tuesday’s break from balance. Does this guarantee an upside continuation? No, but the probability favors continued upside pressure, as the auction is likely not finished to the upside.
Today’s session cleaned up Tuesday’s poor structure and established value within the upper distribution—suggesting bullish consolidation until proven otherwise. The situation remains unchanged: buyers maintain firm control above Tuesday’s initial balance and remain comfortable as long as value builds above last week’s range. For sellers, the primary objective continues to be a return to last week’s range, which would bring a failed breakout into play.
In terms of levels, the Smashlevel is at 6136/6130. Holding above 6136 would signal strength, targeting the resistance area between 6166 and 6175 (UT1), with a final upside target (FUT) at 6200 under sustained buying pressure.
On the flip side, failure to hold above 6130 would target last week’s high at 6109 (DT1), with a final downside target (FDT) at 6081, the unfilled daily gap, under sustained selling pressure.
Levels of Interest
Going into tomorrow’s session, I’ll closely observe the behavior around 6136/6130.
Holding above 6136 would target 6166 / 6175 / 6200
Break and hold below 6130 would target 6109 / 6081
Additionally, pay attention to the following VIX levels: 17.68 and 15.82. These levels can provide confirmation of strength or weakness.
Break and hold above 6200 with VIX below 15.82 would confirm strength.
Break and hold below 6081 with VIX above 17.68 would confirm weakness.
Overall, it's important to exercise caution when trading outside of the highlighted yellow levels. A non-cooperative VIX may suggest possible reversals i.e trade setups.


Many thanks!
Smash, do you have a recommended video or literature I can read to gain a better understanding of your methods? Thank you!