ES Daily Plan | June 26, 2024
Currently, the market is in a 6-day balance, coiling for a directional move while awaiting further market-generated information.
For new followers: the yellow levels highlighted at the bottom are the primary levels that I focus on intraday. My strategy for preventing impulsive decisions at unfavorable locations involves following a simple yet effective rule of exercising caution when initiating trades outside of the yellow levels. This implies that I am cautious chasing longs above the final yellow upside target and shorts below the final yellow downside target. It is crucial to understand that refraining from chasing a trade is not an automatic invitation to initiate a trade in the opposite direction.
Visual Representation
Contextual Analysis
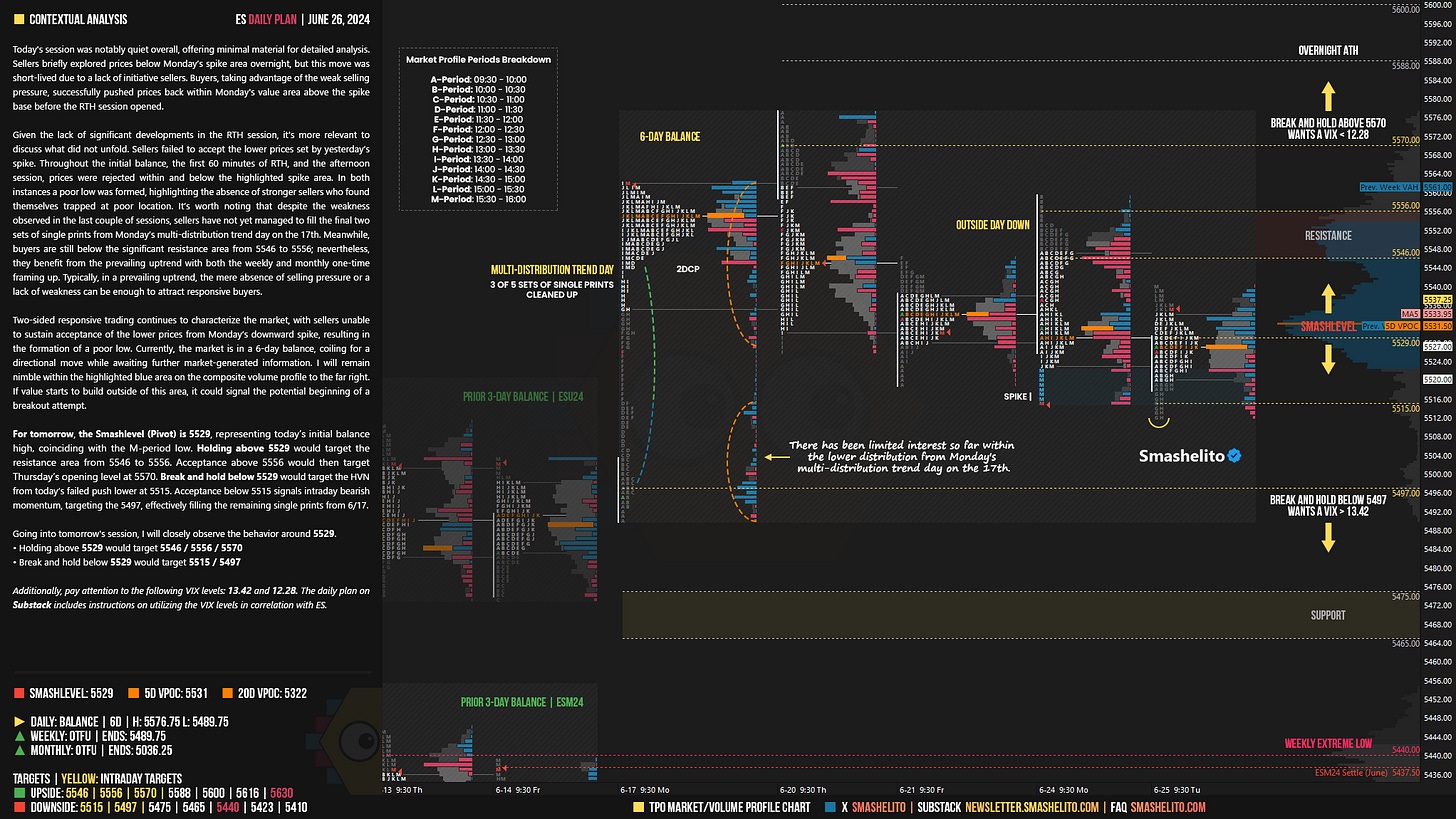
Today's session was notably quiet overall, offering minimal material for detailed analysis. Sellers briefly explored prices below Monday’s spike area overnight, but this move was short-lived due to a lack of initiative sellers. Buyers, taking advantage of the weak selling pressure, successfully pushed prices back within Monday's value area above the spike base before the RTH session opened.
Given the lack of significant developments in the RTH session, it's more relevant to discuss what did not unfold. Sellers failed to accept the lower prices set by yesterday’s spike. Throughout the initial balance, the first 60 minutes of RTH, and the afternoon session, prices were rejected within and below the highlighted spike area. In both instances a poor low was formed, highlighting the absence of stronger sellers who found themselves trapped at poor location. It’s worth noting that despite the weakness observed in the last couple of sessions, sellers have not yet managed to fill the final two sets of single prints from Monday’s multi-distribution trend day on the 17th. Meanwhile, buyers are still below the significant resistance area from 5546 to 5556; nevertheless, they benefit from the prevailing uptrend with both the weekly and monthly one-time framing up. Typically, in a prevailing uptrend, the mere absence of selling pressure or a lack of weakness can be enough to attract responsive buyers.
Two-sided responsive trading continues to characterize the market, with sellers unable to sustain acceptance of the lower prices from Monday’s downward spike, resulting in the formation of a poor low. Currently, the market is in a 6-day balance, coiling for a directional move while awaiting further market-generated information. I will remain nimble within the highlighted blue area on the composite volume profile to the far right. If value starts to build outside of this area, it could signal the potential beginning of a breakout attempt.
For tomorrow, the Smashlevel (Pivot) is 5529, representing today’s initial balance high, coinciding with the M-period low. Holding above 5529 would target the resistance area from 5546 to 5556. Acceptance above 5556 would then target Thursday’s opening level at 5570. Break and hold below 5529 would target the HVN from today’s failed push lower at 5515. Acceptance below 5515 signals intraday bearish momentum, targeting the 5497, effectively filling the remaining single prints from 6/17.
Levels of Interest
Going into tomorrow's session, I will closely observe the behavior around 5529.
Holding above 5529 would target 5546 / 5556 / 5570
Break and hold below 5529 would target 5515 / 5497
Additionally, pay attention to the following VIX levels: 13.42 and 12.28. These levels can provide confirmation of strength or weakness.
Break and hold above 5570 with VIX below 12.28 would confirm strength.
Break and hold below 5497 with VIX above 13.42 would confirm weakness.
Overall, it's important to exercise caution when trading outside of the highlighted yellow levels. A non-cooperative VIX may suggest possible reversals i.e trade setups.
Weekly Plan
Be sure to check out the Weekly Plan, which provides a broader perspective and highlights significant levels of interest to watch in the coming week.
Disclaimer: Futures and options trading involves a high level of risk, with the potential for substantial losses. The information provided in this newsletter is for informational purposes only and is not intended to be a trade recommendation. It is the responsibility of the reader to make their own investment decisions and they should seek the advice of a qualified securities professional before making any investments. The owners/authors of this newsletter are not certified as registered financial professionals or investment advisers.


If you get a chance, can you explain why the low is poor? I see 5511.75 as the LoD in H period. Next low was in G period which was 2 ticks higher. Thanks!