
ES Daily Plan | June 25, 2026
Market Context & Key Levels for the Day Ahead

— For new subscribers
The yellow levels highlighted at the bottom left of the chart are the primary intraday levels I focus on. To avoid impulsive decisions at poor trade locations, I follow a simple but effective rule: exercise caution when initiating trades outside of these yellow levels.
This means I’m cautious about chasing longs above the Final Upside Target (FUT) and shorts below the Final Downside Target (FDT). It’s important to understand that not chasing does not imply initiating a trade in the opposite direction, discipline over impulse.
Be sure to review the Weekly Plan for a broader perspective, key levels, and market expectations for the week ahead.

Contextual Analysis & Plan
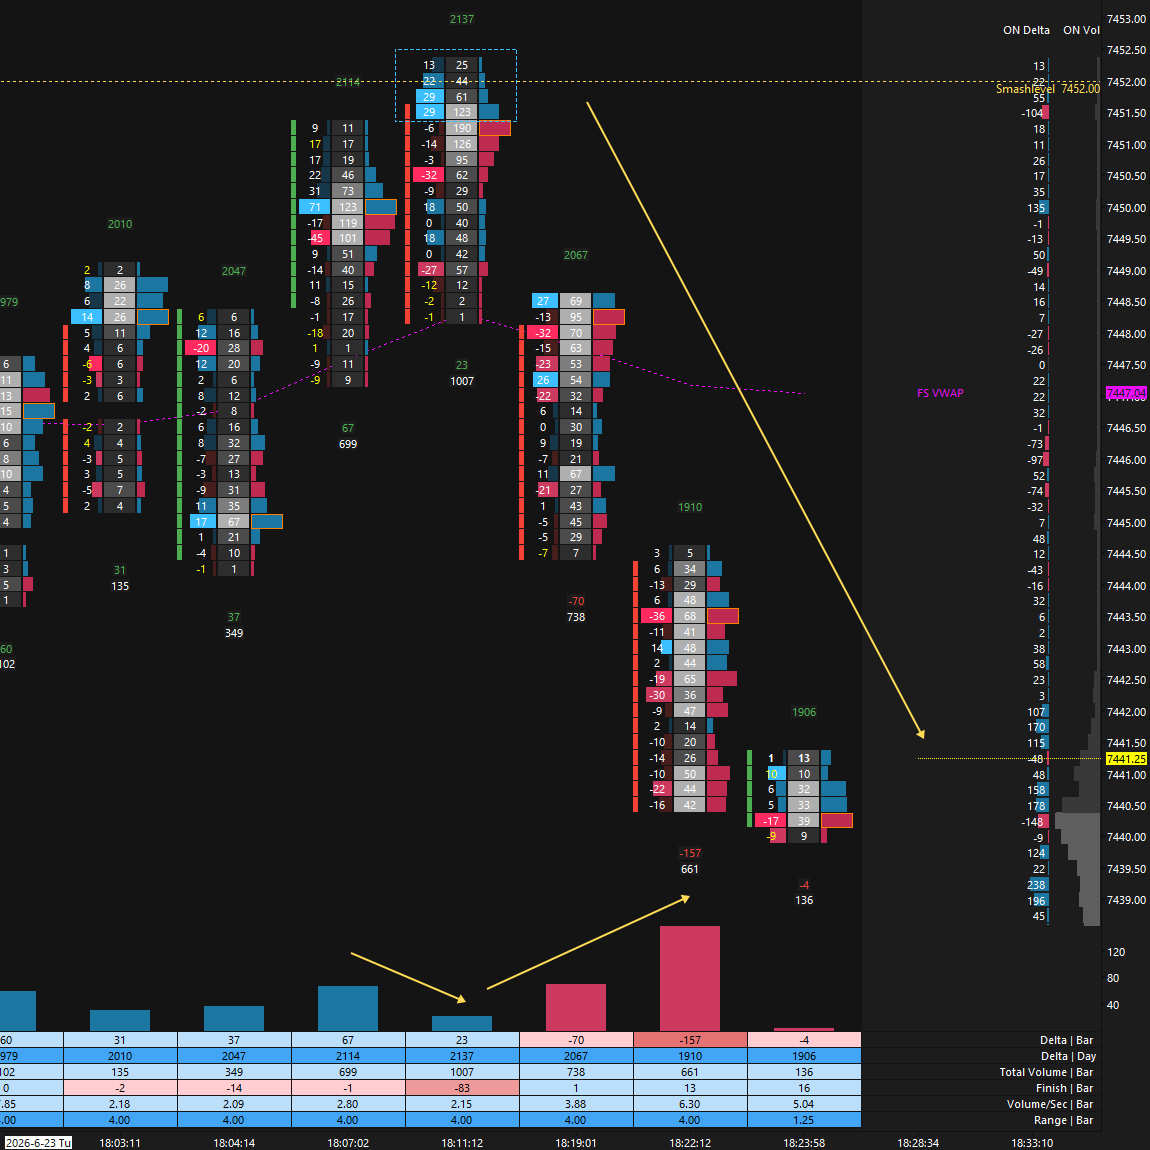
The overnight session provided great opportunities early on, as an immediate test of 7452 (Smashlevel) saw aggressive buyers absorbed, leading to a reversal (see Figure 1). This was followed by a Look Below and Fail (LBAF) of 7429 (DT1), which triggered a rotation higher. Overall, the overnight session remained relatively uneventful, trading within Tuesday’s range.
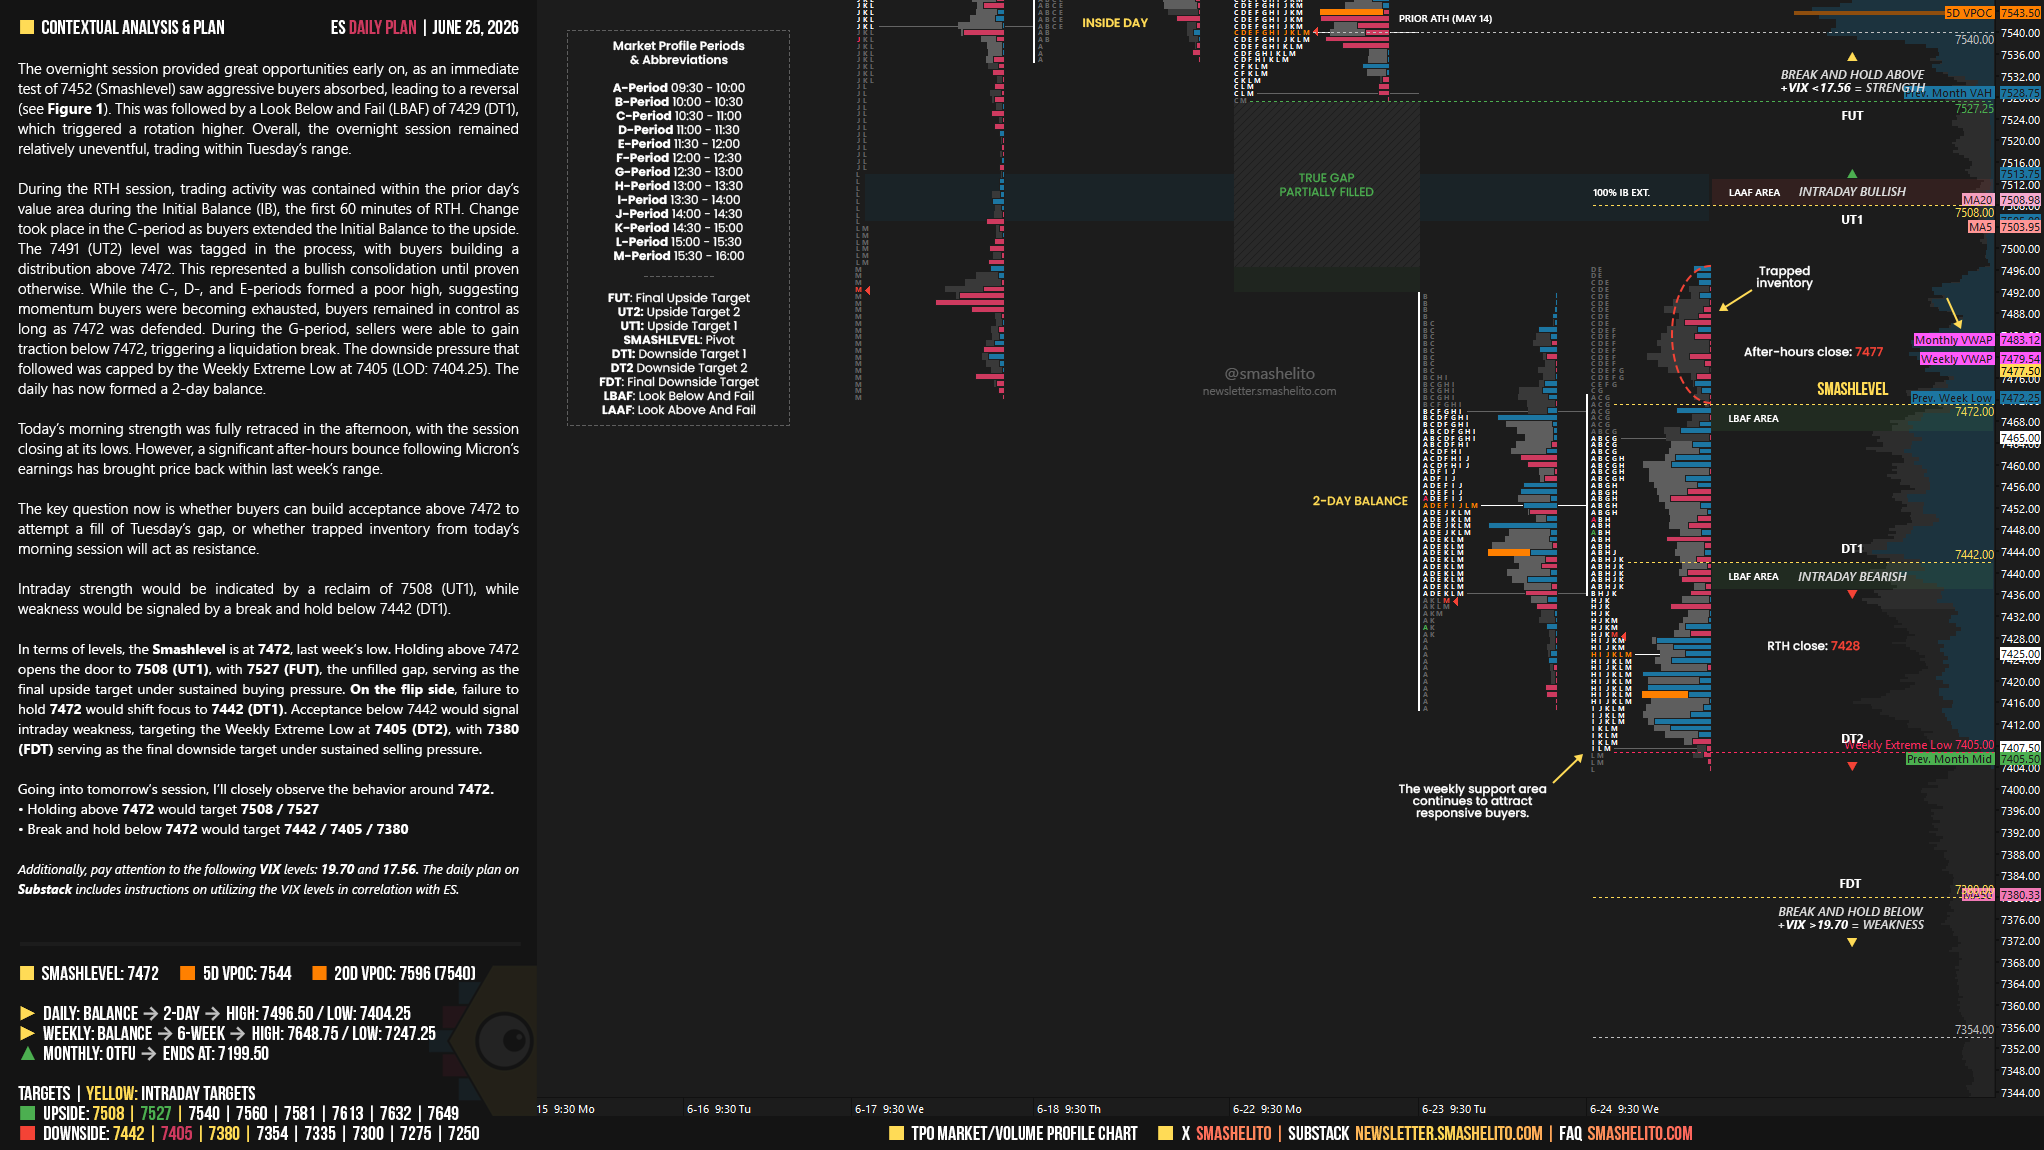
During the RTH session, trading activity was contained within the prior day’s value area during the Initial Balance (IB), the first 60 minutes of RTH. Change took place in the C-period as buyers extended the Initial Balance to the upside. The 7491 (UT2) level was tagged in the process, with buyers building a distribution above 7472. This represented a bullish consolidation until proven otherwise. While the C-, D-, and E-periods formed a poor high, suggesting momentum buyers were becoming exhausted, buyers remained in control as long as 7472 was defended. During the G-period, sellers were able to gain traction below 7472, triggering a liquidation break. The downside pressure that followed was capped by the Weekly Extreme Low at 7405 (LOD: 7404.25). The daily has now formed a 2-day balance.
Smashlevels Recap
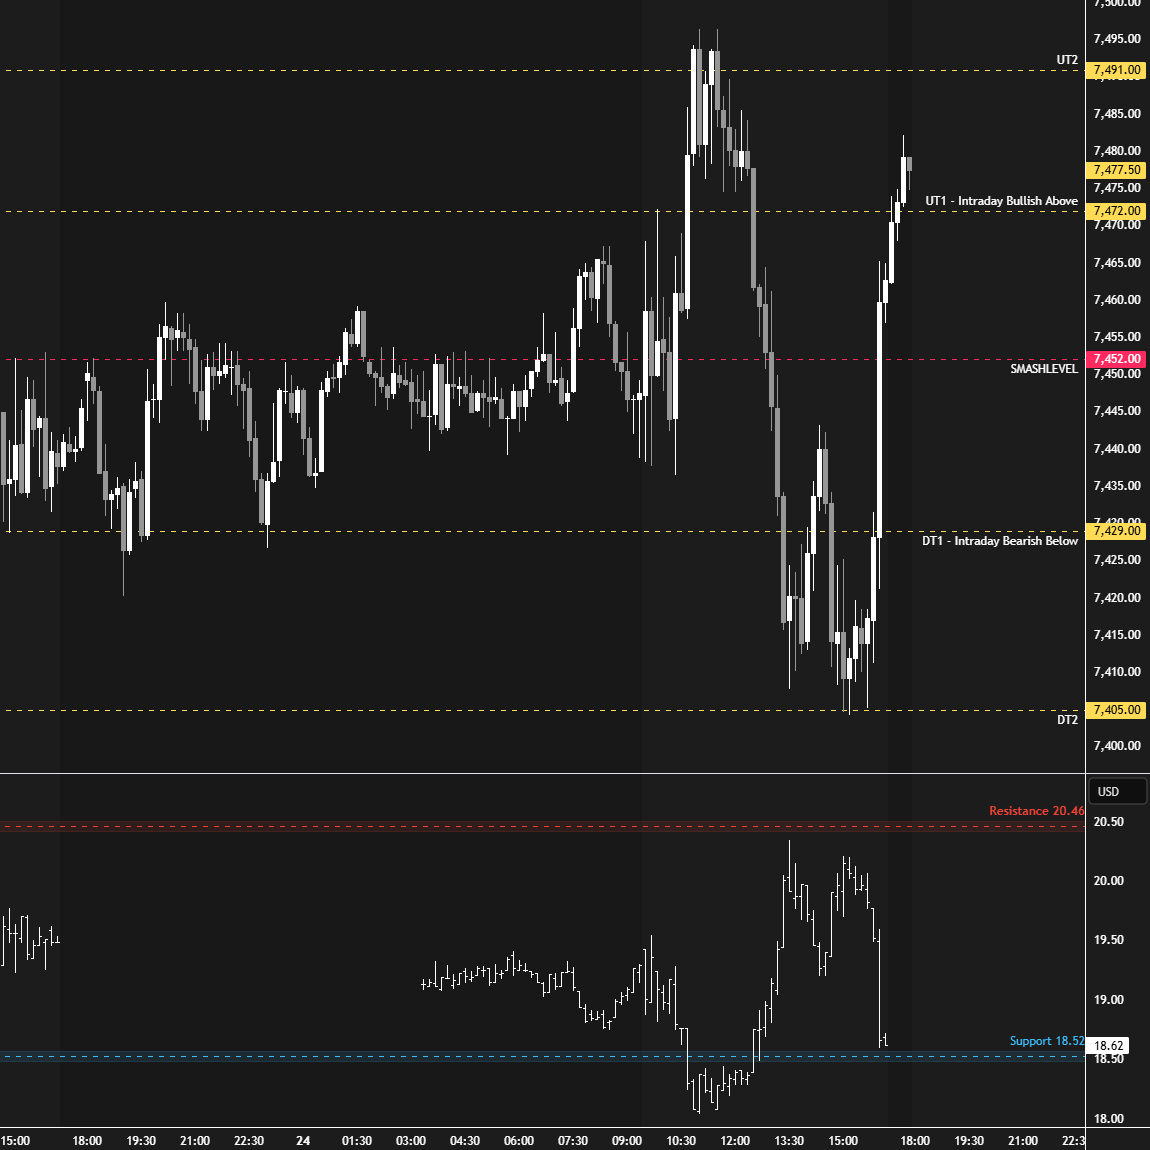
Today’s morning strength was fully retraced in the afternoon, with the session closing at its lows. However, a significant after-hours bounce following Micron’s earnings has brought price back within last week’s range.
The key question now is whether buyers can build acceptance above 7472 to attempt a fill of Tuesday’s gap, or whether trapped inventory from today’s morning session will act as resistance.
Intraday strength would be indicated by a reclaim of 7508 (UT1), while weakness would be signaled by a break and hold below 7442 (DT1).
In terms of levels, the Smashlevel is at 7472, last week’s low. Holding above 7472 opens the door to 7508 (UT1), with 7527 (FUT), the unfilled gap, serving as the final upside target under sustained buying pressure.
On the flip side, failure to hold 7472 would shift focus to 7442 (DT1). Acceptance below 7442 would signal intraday weakness, targeting the Weekly Extreme Low at 7405 (DT2), with 7380 (FDT) serving as the final downside target under sustained selling pressure.
Visual Representation
Levels of Interest
Going into tomorrow’s session, I’ll closely observe the behavior around 7472.
Holding above 7472 would target 7508 / 7527
Break and hold below 7472 would target 7442 / 7405 / 7380
Additionally, pay attention to the following VIX levels: 19.70 and 17.56. These levels can provide confirmation of strength or weakness.
Break and hold above 7527 with VIX below 17.56 would confirm strength.
Break and hold below 7380 with VIX above 19.70 would confirm weakness.
Overall, it's important to exercise caution when trading outside of the highlighted yellow levels. A non-cooperative VIX may suggest possible reversals i.e trade setups.
Might not sound like much but your newsletters cheer me up a great deal during my hospital visits. Thank you kindly Smash
I really appreciate every newsletter you send out. I've been reading them daily for almost a year now, and I have constant respect and admiration for everything that goes into them.