ES Daily Plan | June 25, 2025
Recap, Market Context & Key Levels for the Day Ahead
— For new subscribers
The yellow levels highlighted at the bottom left of the chart are the primary intraday levels I focus on. To avoid impulsive decisions at poor trade locations, I follow a simple but effective rule: exercise caution when initiating trades outside of these yellow levels.
This means I’m cautious about chasing longs above the Final Upside Target (FUT) and shorts below the Final Downside Target (FDT). It’s important to understand that not chasing does not imply initiating a trade in the opposite direction — discipline over impulse.
Be sure to review the ES Weekly Plan | June 23-27, 2025 for a broader perspective, key levels, and market expectations for the week ahead.
Contextual Analysis & Plan
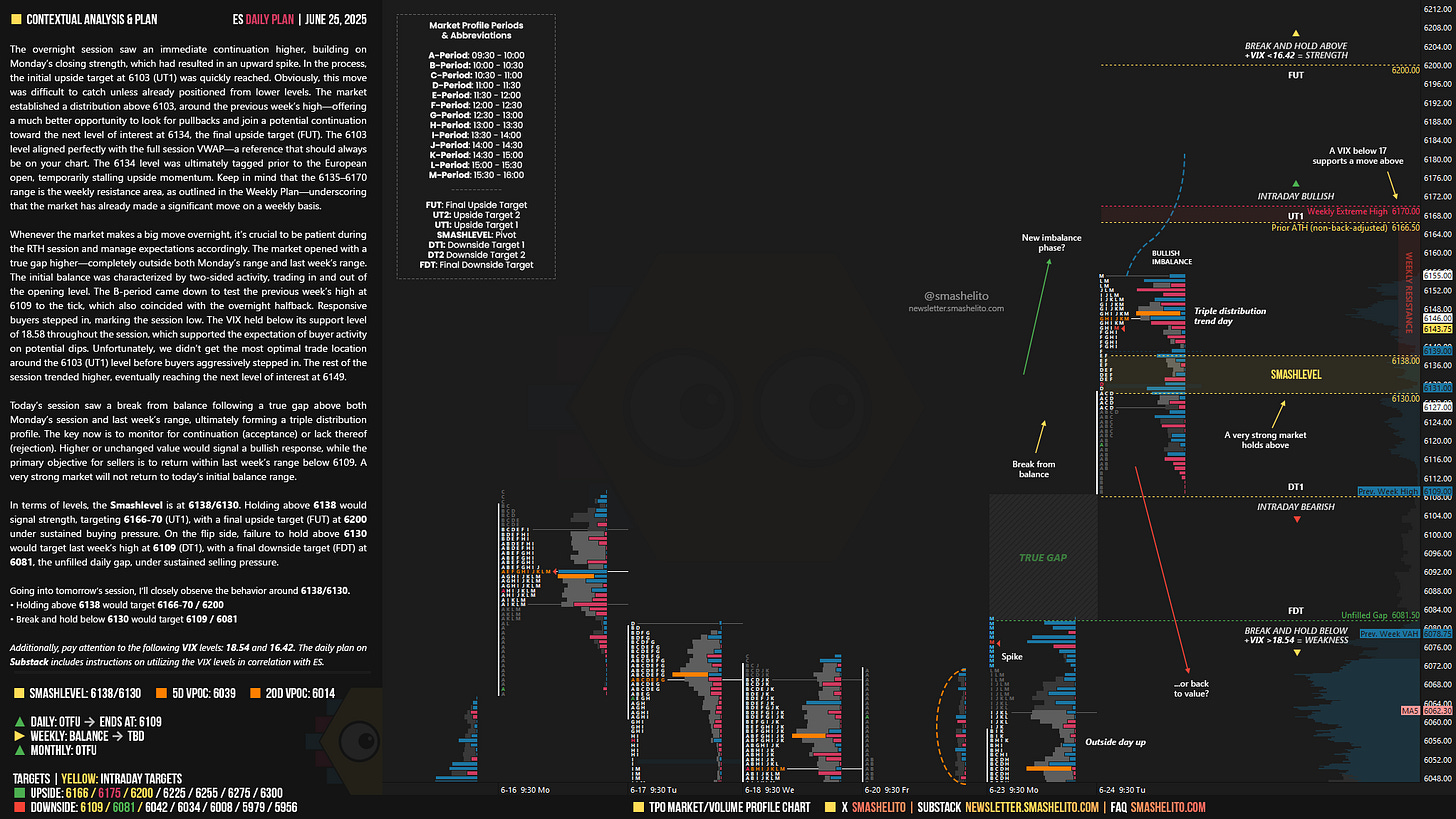
The overnight session saw an immediate continuation higher, building on Monday’s closing strength, which had resulted in an upward spike. In the process, the initial upside target at 6103 (UT1) was quickly reached. Obviously, this move was difficult to catch unless already positioned from lower levels. The market established a distribution above 6103, around the previous week’s high—offering a much better opportunity to look for pullbacks and join a potential continuation toward the next level of interest at 6134, the final upside target (FUT). The 6103 level aligned perfectly with the full session VWAP—a reference that should always be on your chart. The 6134 level was ultimately tagged prior to the European open, temporarily stalling upside momentum. Keep in mind that the 6135–6170 range is the weekly resistance area, as outlined in the Weekly Plan—underscoring that the market has already made a significant move on a weekly basis.
Whenever the market makes a big move overnight, it’s crucial to be patient during the RTH session and manage expectations accordingly. The market opened with a true gap higher—completely outside both Monday’s range and last week’s range. The initial balance was characterized by two-sided activity, trading in and out of the opening level. The B-period came down to test the previous week’s high at 6109 to the tick, which also coincided with the overnight halfback. Responsive buyers stepped in, marking the session low. The VIX held below its support level of 18.58 throughout the session, which supported the expectation of buyer activity on potential dips. Unfortunately, we didn’t get the most optimal trade location around the 6103 (UT1) level before buyers aggressively stepped in. The rest of the session trended higher, eventually reaching the next level of interest at 6149.
Today’s session saw a break from balance following a true gap above both Monday’s session and last week’s range, ultimately forming a triple distribution profile. The key now is to monitor for continuation (acceptance) or lack thereof (rejection). Higher or unchanged value would signal a bullish response, while the primary objective for sellers is to return within last week’s range below 6109. A very strong market will not return to today’s initial balance range.
In terms of levels, the Smashlevel is at 6138/6130. Holding above 6138 would signal strength, targeting 6166-70 (UT1), with a final upside target (FUT) at 6200 under sustained buying pressure.
On the flip side, failure to hold above 6130 would target last week’s high at 6109 (DT1), with a final downside target (FDT) at 6081, the unfilled daily gap, under sustained selling pressure.
Levels of Interest
Going into tomorrow’s session, I’ll closely observe the behavior around 6138/6130.
Holding above 6138 would target 6166-70 / 6200
Break and hold below 6130 would target 6109 / 6081
Additionally, pay attention to the following VIX levels: 18.54 and 16.42. These levels can provide confirmation of strength or weakness.
Break and hold above 6200 with VIX below 16.42 would confirm strength.
Break and hold below 6081 with VIX above 18.54 would confirm weakness.
Overall, it's important to exercise caution when trading outside of the highlighted yellow levels. A non-cooperative VIX may suggest possible reversals i.e trade setups.


Thanks Smash!
Thank you very much!