
ES Daily Plan | June 2, 2025
Market Context & Key Levels for the Day Ahead

— For new followers
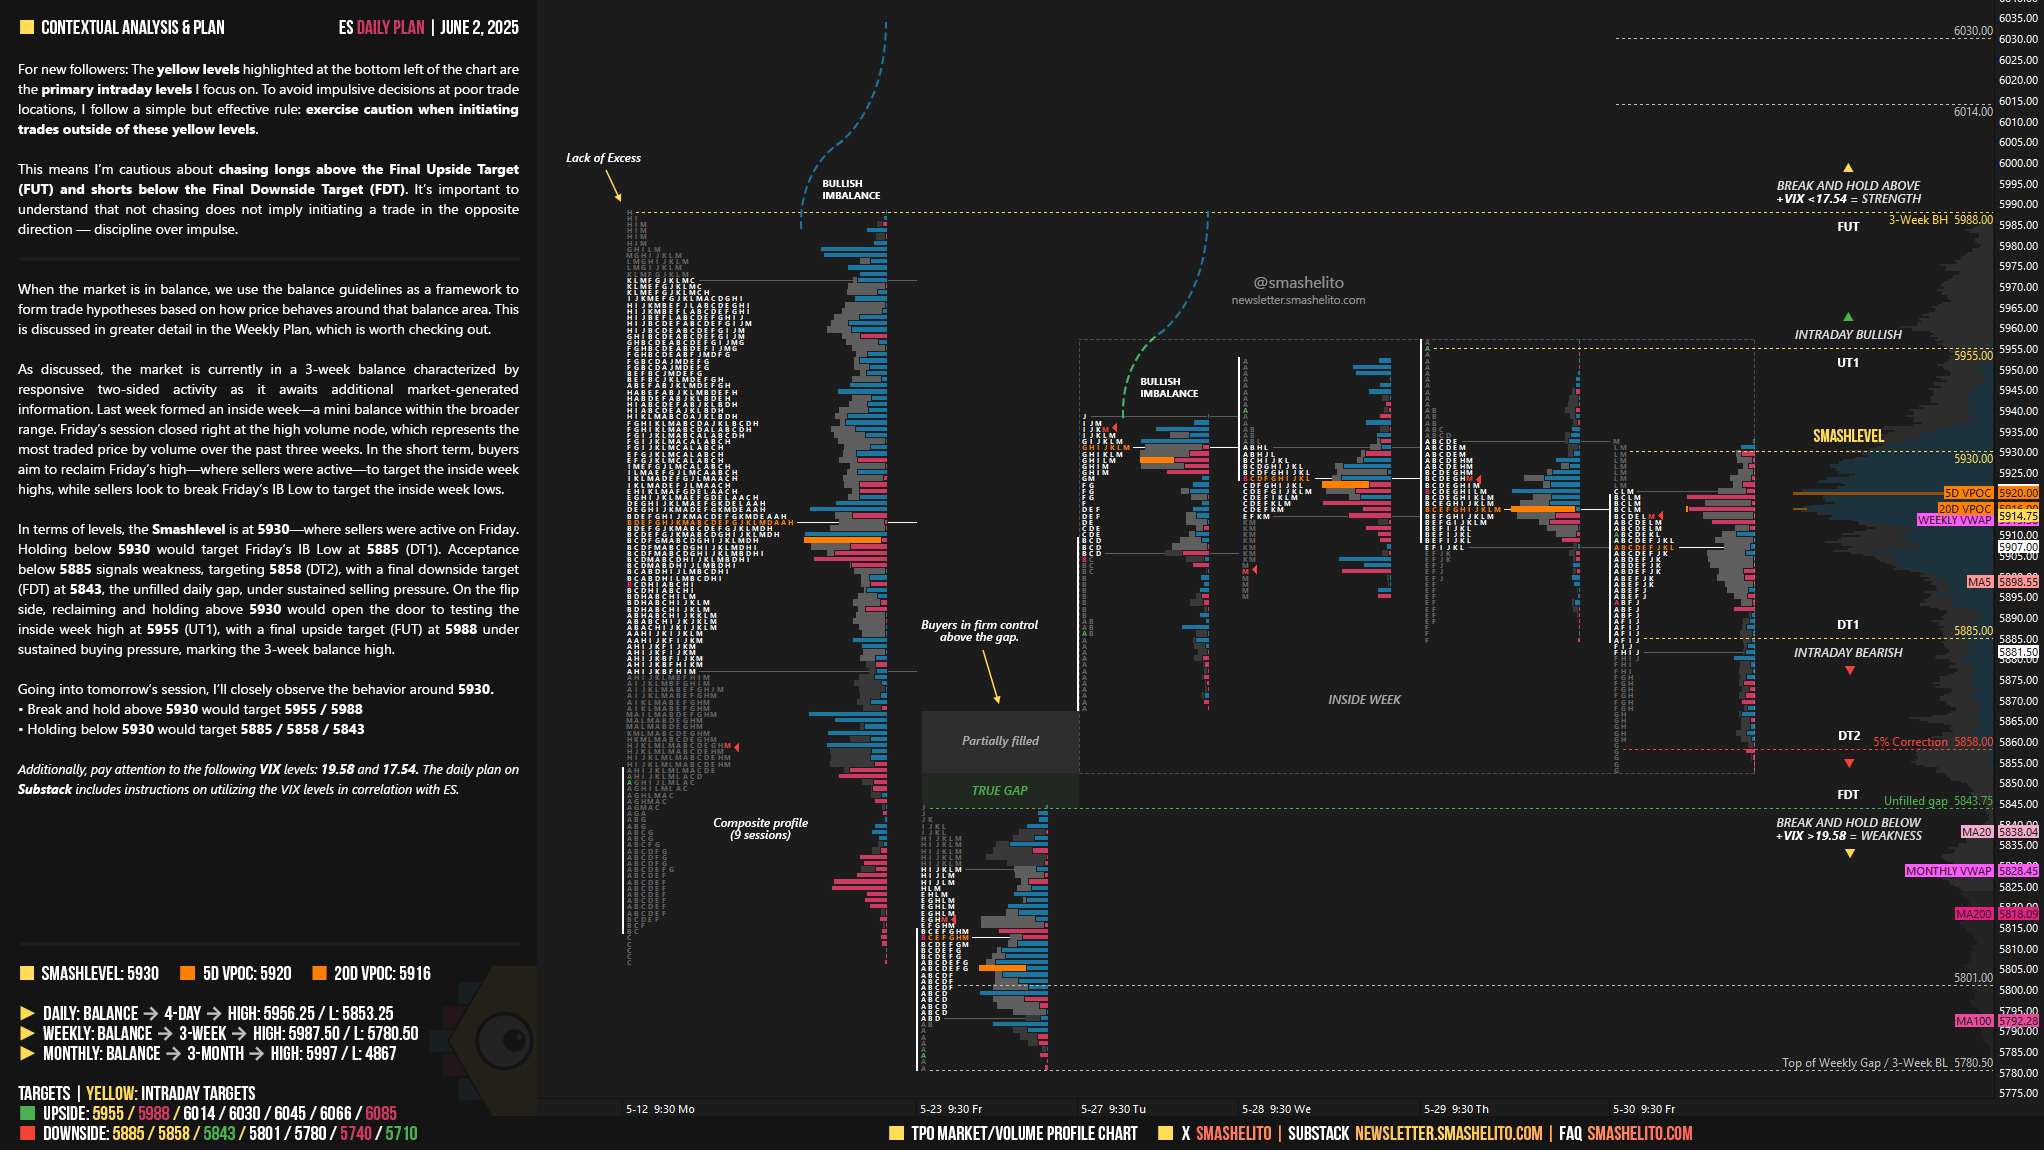
The yellow levels highlighted at the bottom left of the chart are the primary intraday levels I focus on. To avoid impulsive decisions at poor trade locations, I follow a simple but effective rule: exercise caution when initiating trades outside of these yellow levels.
This means I’m cautious about chasing longs above the Final Upside Target (FUT) and shorts below the Final Downside Target (FDT). It’s important to understand that not chasing does not imply initiating a trade in the opposite direction — discipline over impulse.
Be sure to review the ES Weekly Plan | June 2-6, 2025 for a broader perspective, key levels, and market expectations for the week ahead.
Contextual Analysis & Plan
When the market is in balance, we use the balance guidelines as a framework to form trade hypotheses based on how price behaves around that balance area. This is discussed in greater detail in the Weekly Plan, which is worth checking out.
As discussed, the market is currently in a 3-week balance characterized by responsive two-sided activity as it awaits additional market-generated information. Last week formed an inside week—a mini balance within the broader range. Friday’s session closed right at the high volume node, which represents the most traded price by volume over the past three weeks. In the short term, buyers aim to reclaim Friday’s high—where sellers were active—to target the inside week highs, while sellers look to break Friday’s IB Low to target the inside week lows.
In terms of levels, the Smashlevel is at 5930—where sellers were active on Friday. Holding below 5930 would target Friday’s IB Low at 5885 (DT1). Acceptance below 5885 signals weakness, targeting 5858 (DT2), with a final downside target (FDT) at 5843, the unfilled daily gap, under sustained selling pressure.
On the flip side, reclaiming and holding above 5930 would open the door to testing the inside week high at 5955 (UT1), with a final upside target (FUT) at 5988 under sustained buying pressure, marking the 3-week balance high.
Levels of Interest
Going into tomorrow’s session, I’ll closely observe the behavior around 5930.
Break and hold above 5930 would target 5955 / 5988
Holding below 5930 would target 5885 / 5858 / 5843
Additionally, pay attention to the following VIX levels: 19.58 and 17.54. These levels can provide confirmation of strength or weakness.
Break and hold above 5988 with VIX below 17.54 would confirm strength.
Break and hold below 5843 with VIX above 19.58 would confirm weakness.
Overall, it's important to exercise caution when trading outside of the highlighted yellow levels. A non-cooperative VIX may suggest possible reversals i.e trade setups.
SMASH the like button ❤️
Thanks you as always.