
ES Daily Plan | June 18, 2026
Market Context & Key Levels for the Day Ahead

— For new subscribers
The yellow levels highlighted at the bottom left of the chart are the primary intraday levels I focus on. To avoid impulsive decisions at poor trade locations, I follow a simple but effective rule: exercise caution when initiating trades outside of these yellow levels.
This means I’m cautious about chasing longs above the Final Upside Target (FUT) and shorts below the Final Downside Target (FDT). It’s important to understand that not chasing does not imply initiating a trade in the opposite direction, discipline over impulse.
Be sure to review the Weekly Plan for a broader perspective, key levels, and market expectations for the week ahead.

Contract Rollover
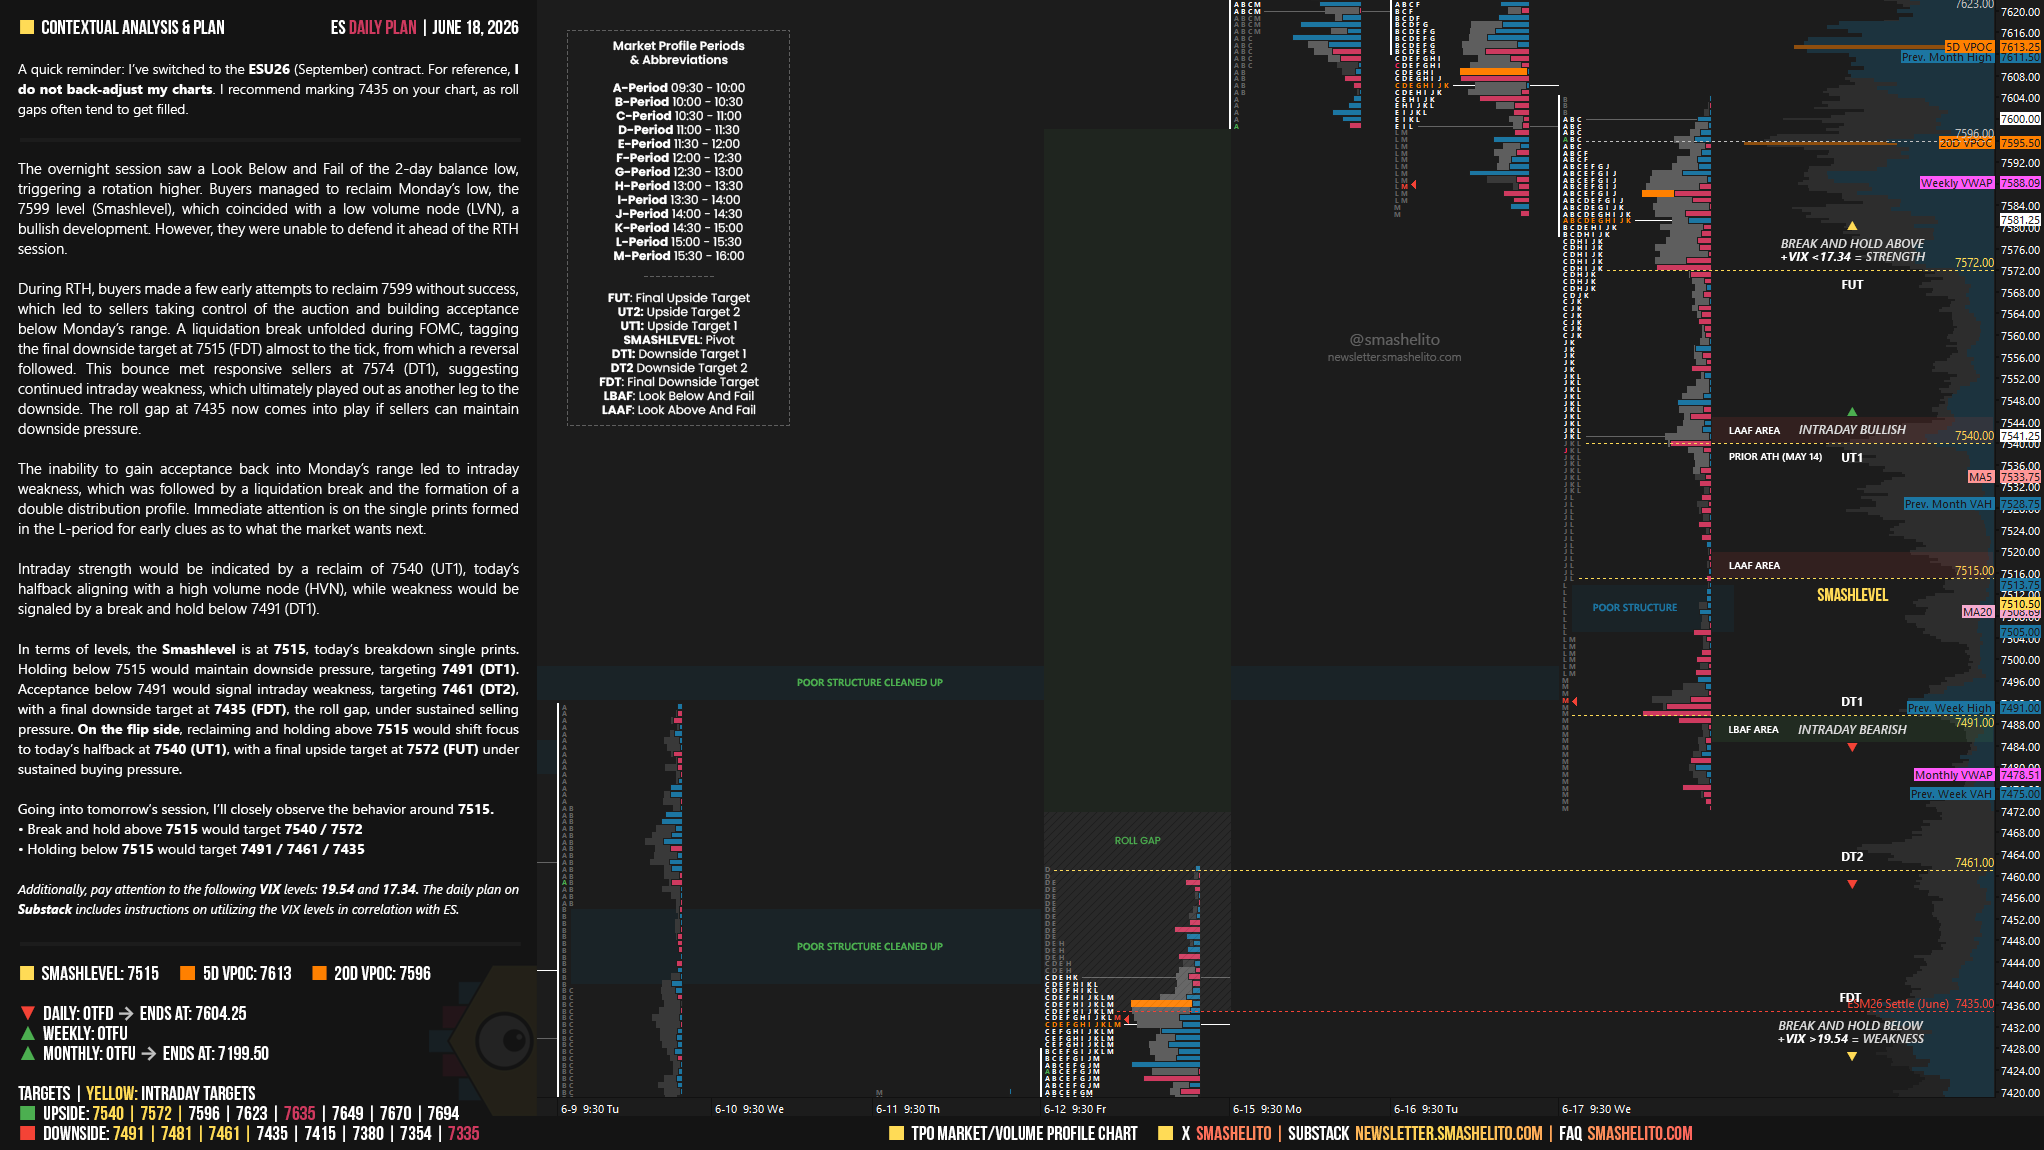
A quick reminder: I’ve switched to the ESU26 (September) contract. For reference, I do not back-adjust my charts. I recommend marking 7435 on your chart, as roll gaps often tend to get filled.
Contract rollovers can be confusing. While some traders back-adjust their charts, I prefer to leave historical levels unchanged, which leaves a visible roll gap. This is purely a matter of personal preference, neither approach is inherently superior; both have pros and cons.
For short-term traders, the impact is usually minimal since we navigate the market day by day. During rollover periods, I typically scale back activity because order flow becomes noticeably less reliable.
Contextual Analysis & Plan
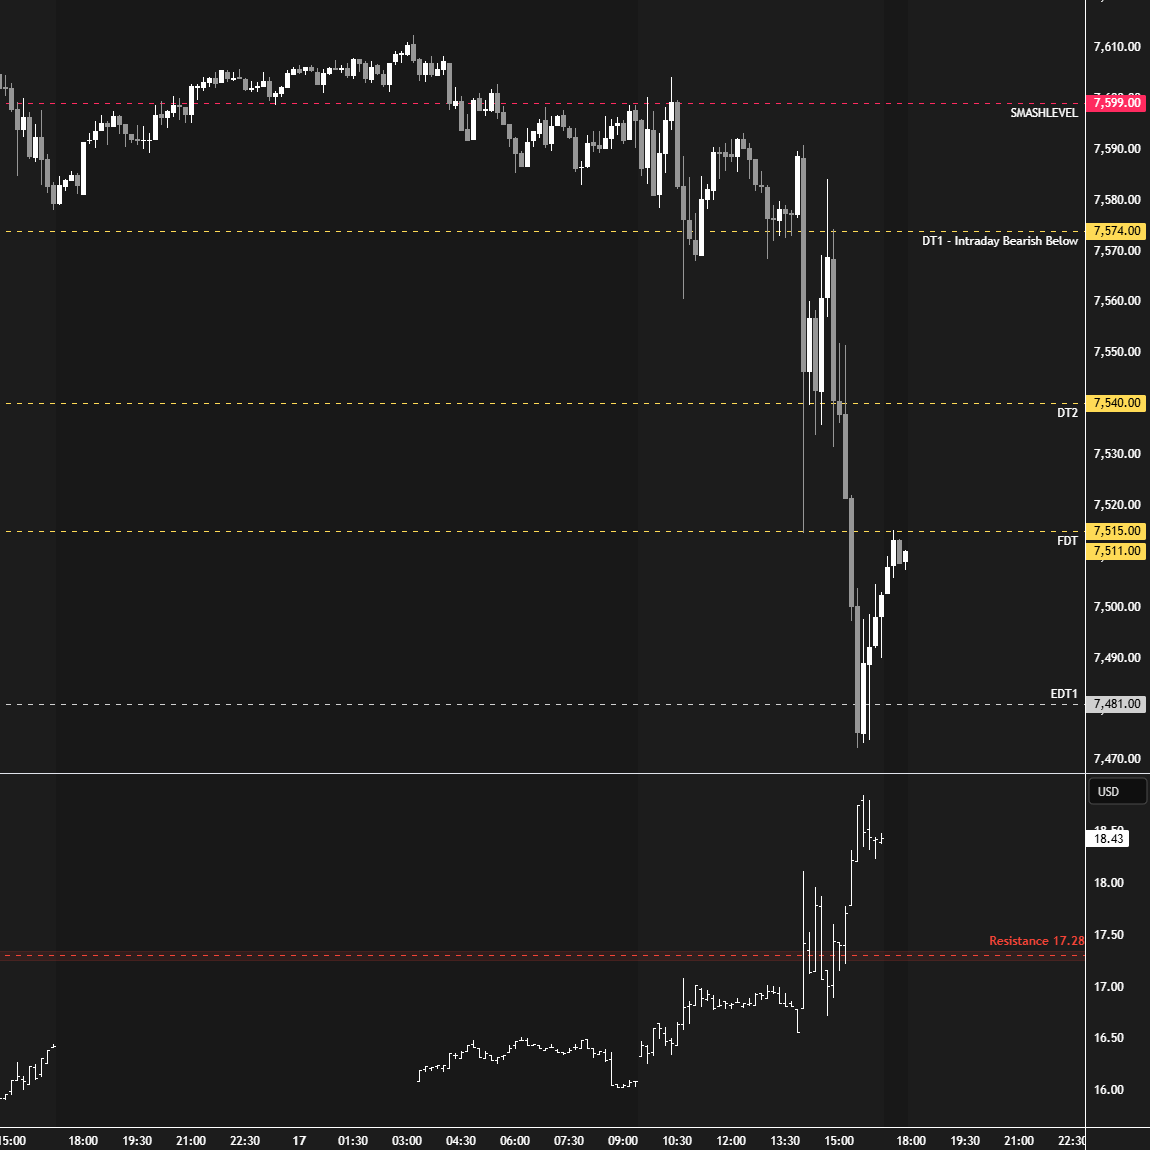
The overnight session saw a Look Below and Fail of the 2-day balance low, triggering a rotation higher. Buyers managed to reclaim Monday’s low, the 7599 level (Smashlevel), which coincided with a low volume node (LVN), a bullish development. However, they were unable to defend it ahead of the RTH session.
During RTH, buyers made a few early attempts to reclaim 7599 without success, which led to sellers taking control of the auction and building acceptance below Monday’s range. A liquidation break unfolded during FOMC, tagging the final downside target at 7515 (FDT) almost to the tick, from which a reversal followed. This bounce met responsive sellers at 7574 (DT1), suggesting continued intraday weakness, which ultimately played out as another leg to the downside. The roll gap at 7435 now comes into play if sellers can maintain downside pressure.
Smashlevels Recap
The inability to gain acceptance back into Monday’s range led to intraday weakness, which was followed by a liquidation break and the formation of a double distribution profile. Immediate attention is on the single prints formed in the L-period for early clues as to what the market wants next.
Intraday strength would be indicated by a reclaim of 7540 (UT1), today’s halfback aligning with a high volume node (HVN), while weakness would be signaled by a break and hold below 7491 (DT1).
In terms of levels, the Smashlevel is at 7515, today’s breakdown single prints. Holding below 7515 would maintain downside pressure, targeting 7491 (DT1). Acceptance below 7491 would signal intraday weakness, targeting 7461 (DT2), with a final downside target at 7435 (FDT), the roll gap, under sustained selling pressure.
On the flip side, reclaiming and holding above 7515 would shift focus to today’s halfback at 7540 (UT1), with a final upside target at 7572 (FUT) under sustained buying pressure.
Visual Representation
Levels of Interest
Going into tomorrow’s session, I’ll closely observe the behavior around 7515.
Break and hold above 7515 would target 7540 / 7572
Holding below 7515 would target 7491 / 7461 / 7435
Additionally, pay attention to the following VIX levels: 19.54 and 17.34. These levels can provide confirmation of strength or weakness.
Break and hold above 7572 with VIX below 17.34 would confirm strength.
Break and hold below 7435 with VIX above 19.54 would confirm weakness.
Overall, it's important to exercise caution when trading outside of the highlighted yellow levels. A non-cooperative VIX may suggest possible reversals i.e trade setups.
precision levels
The best night time read
Great stuff!