
ES Daily Plan | June 17, 2026
Market Context & Key Levels for the Day Ahead

— For new subscribers
The yellow levels highlighted at the bottom left of the chart are the primary intraday levels I focus on. To avoid impulsive decisions at poor trade locations, I follow a simple but effective rule: exercise caution when initiating trades outside of these yellow levels.
This means I’m cautious about chasing longs above the Final Upside Target (FUT) and shorts below the Final Downside Target (FDT). It’s important to understand that not chasing does not imply initiating a trade in the opposite direction, discipline over impulse.
Be sure to review the Weekly Plan for a broader perspective, key levels, and market expectations for the week ahead.

Contract Rollover
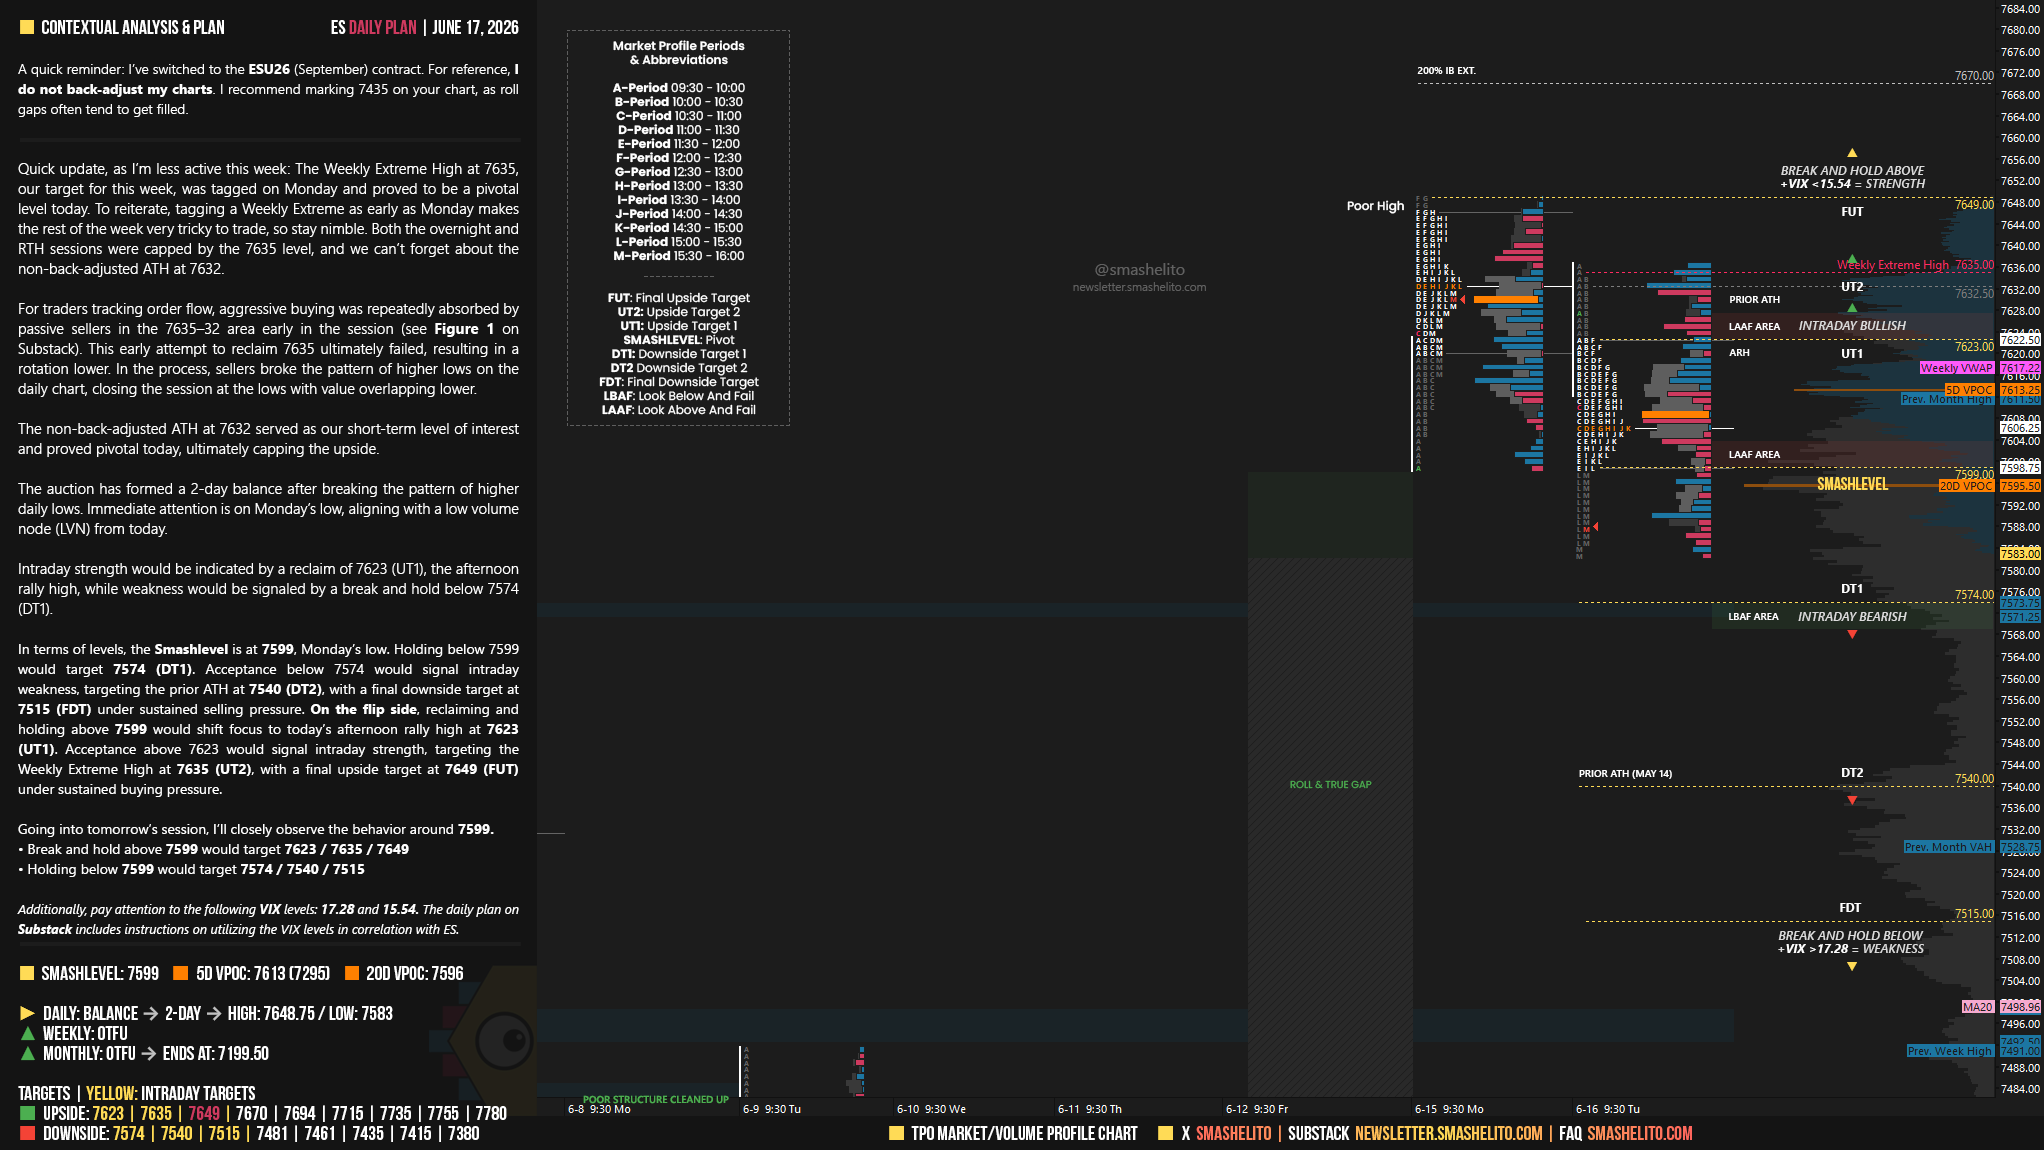
A quick reminder: I’ve switched to the ESU26 (September) contract. For reference, I do not back-adjust my charts. I recommend marking 7435 on your chart, as roll gaps often tend to get filled.
Contract rollovers can be confusing. While some traders back-adjust their charts, I prefer to leave historical levels unchanged, which leaves a visible roll gap. This is purely a matter of personal preference, neither approach is inherently superior; both have pros and cons.
For short-term traders, the impact is usually minimal since we navigate the market day by day. During rollover periods, I typically scale back activity because order flow becomes noticeably less reliable.
Contextual Analysis & Plan
Quick update, as I’m less active this week: The Weekly Extreme High at 7635, our target for this week, was tagged on Monday and proved to be a pivotal level today. To reiterate, tagging a Weekly Extreme as early as Monday makes the rest of the week very tricky to trade, so stay nimble. Both the overnight and RTH sessions were capped by the 7635 level, and we can’t forget about the non-back-adjusted ATH at 7632.
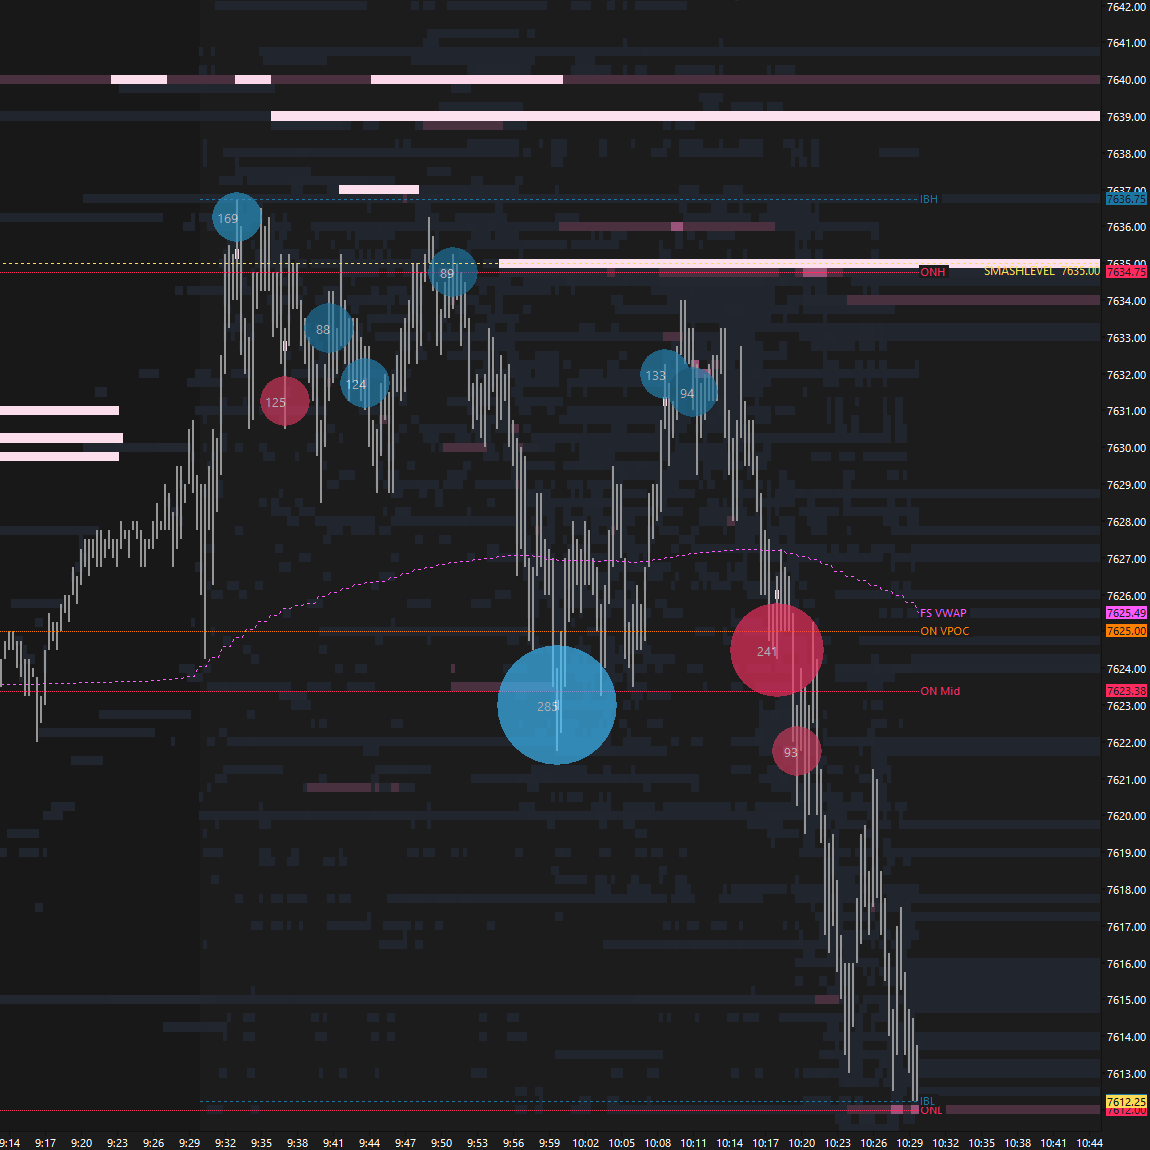
For traders tracking order flow, aggressive buying was repeatedly absorbed by passive sellers in the 7635–32 area early in the session (see Figure 1). This early attempt to reclaim 7635 ultimately failed, resulting in a rotation lower. In the process, sellers broke the pattern of higher lows on the daily chart, closing the session at the lows with value overlapping lower.
Smashlevels Recap
The non-back-adjusted ATH at 7632 served as our short-term level of interest and proved pivotal today, ultimately capping the upside.
The auction has formed a 2-day balance after breaking the pattern of higher daily lows. Immediate attention is on Monday’s low, aligning with a low volume node (LVN) from today.
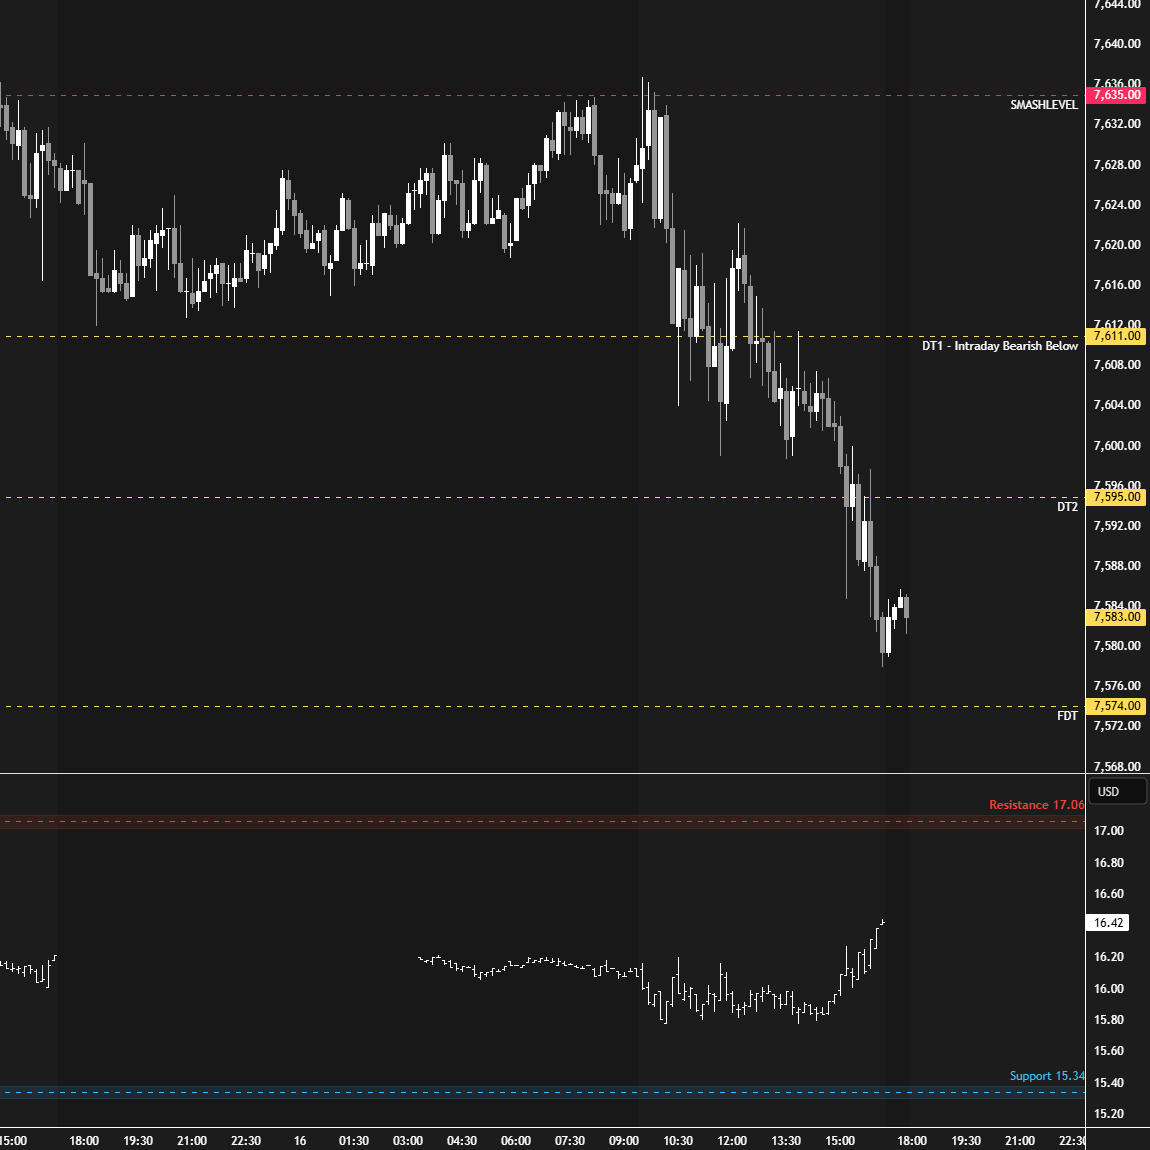
Intraday strength would be indicated by a reclaim of 7623 (UT1), the afternoon rally high, while weakness would be signaled by a break and hold below 7574 (DT1).
In terms of levels, the Smashlevel is at 7599, Monday’s low. Holding below 7599 would target 7574 (DT1). Acceptance below 7574 would signal intraday weakness, targeting the prior ATH at 7540 (DT2), with a final downside target at 7515 (FDT) under sustained selling pressure.
On the flip side, reclaiming and holding above 7599 would shift focus to today’s afternoon rally high at 7623 (UT1). Acceptance above 7623 would signal intraday strength, targeting the Weekly Extreme High at 7635 (UT2), with a final upside target at 7649 (FUT) under sustained buying pressure.
Visual Representation
Levels of Interest
Going into tomorrow’s session, I’ll closely observe the behavior around 7599.
Break and hold above 7599 would target 7623 / 7635 / 7649
Holding below 7599 would target 7574 / 7540 / 7515
Additionally, pay attention to the following VIX levels: 17.28 and 15.54. These levels can provide confirmation of strength or weakness.
Break and hold above 7649 with VIX below 15.54 would confirm strength.
Break and hold below 7515 with VIX above 17.28 would confirm weakness.
Overall, it's important to exercise caution when trading outside of the highlighted yellow levels. A non-cooperative VIX may suggest possible reversals i.e trade setups.
Thank you! 35-32s was a good area.
Thank you Smash