
ES Daily Plan | June 15, 2026
Market Context & Key Levels for the Day Ahead

— For new subscribers
The yellow levels highlighted at the bottom left of the chart are the primary intraday levels I focus on. To avoid impulsive decisions at poor trade locations, I follow a simple but effective rule: exercise caution when initiating trades outside of these yellow levels.
This means I’m cautious about chasing longs above the Final Upside Target (FUT) and shorts below the Final Downside Target (FDT). It’s important to understand that not chasing does not imply initiating a trade in the opposite direction, discipline over impulse.
Be sure to review the Weekly Plan for a broader perspective, key levels, and market expectations for the week ahead.

Contract Rollover
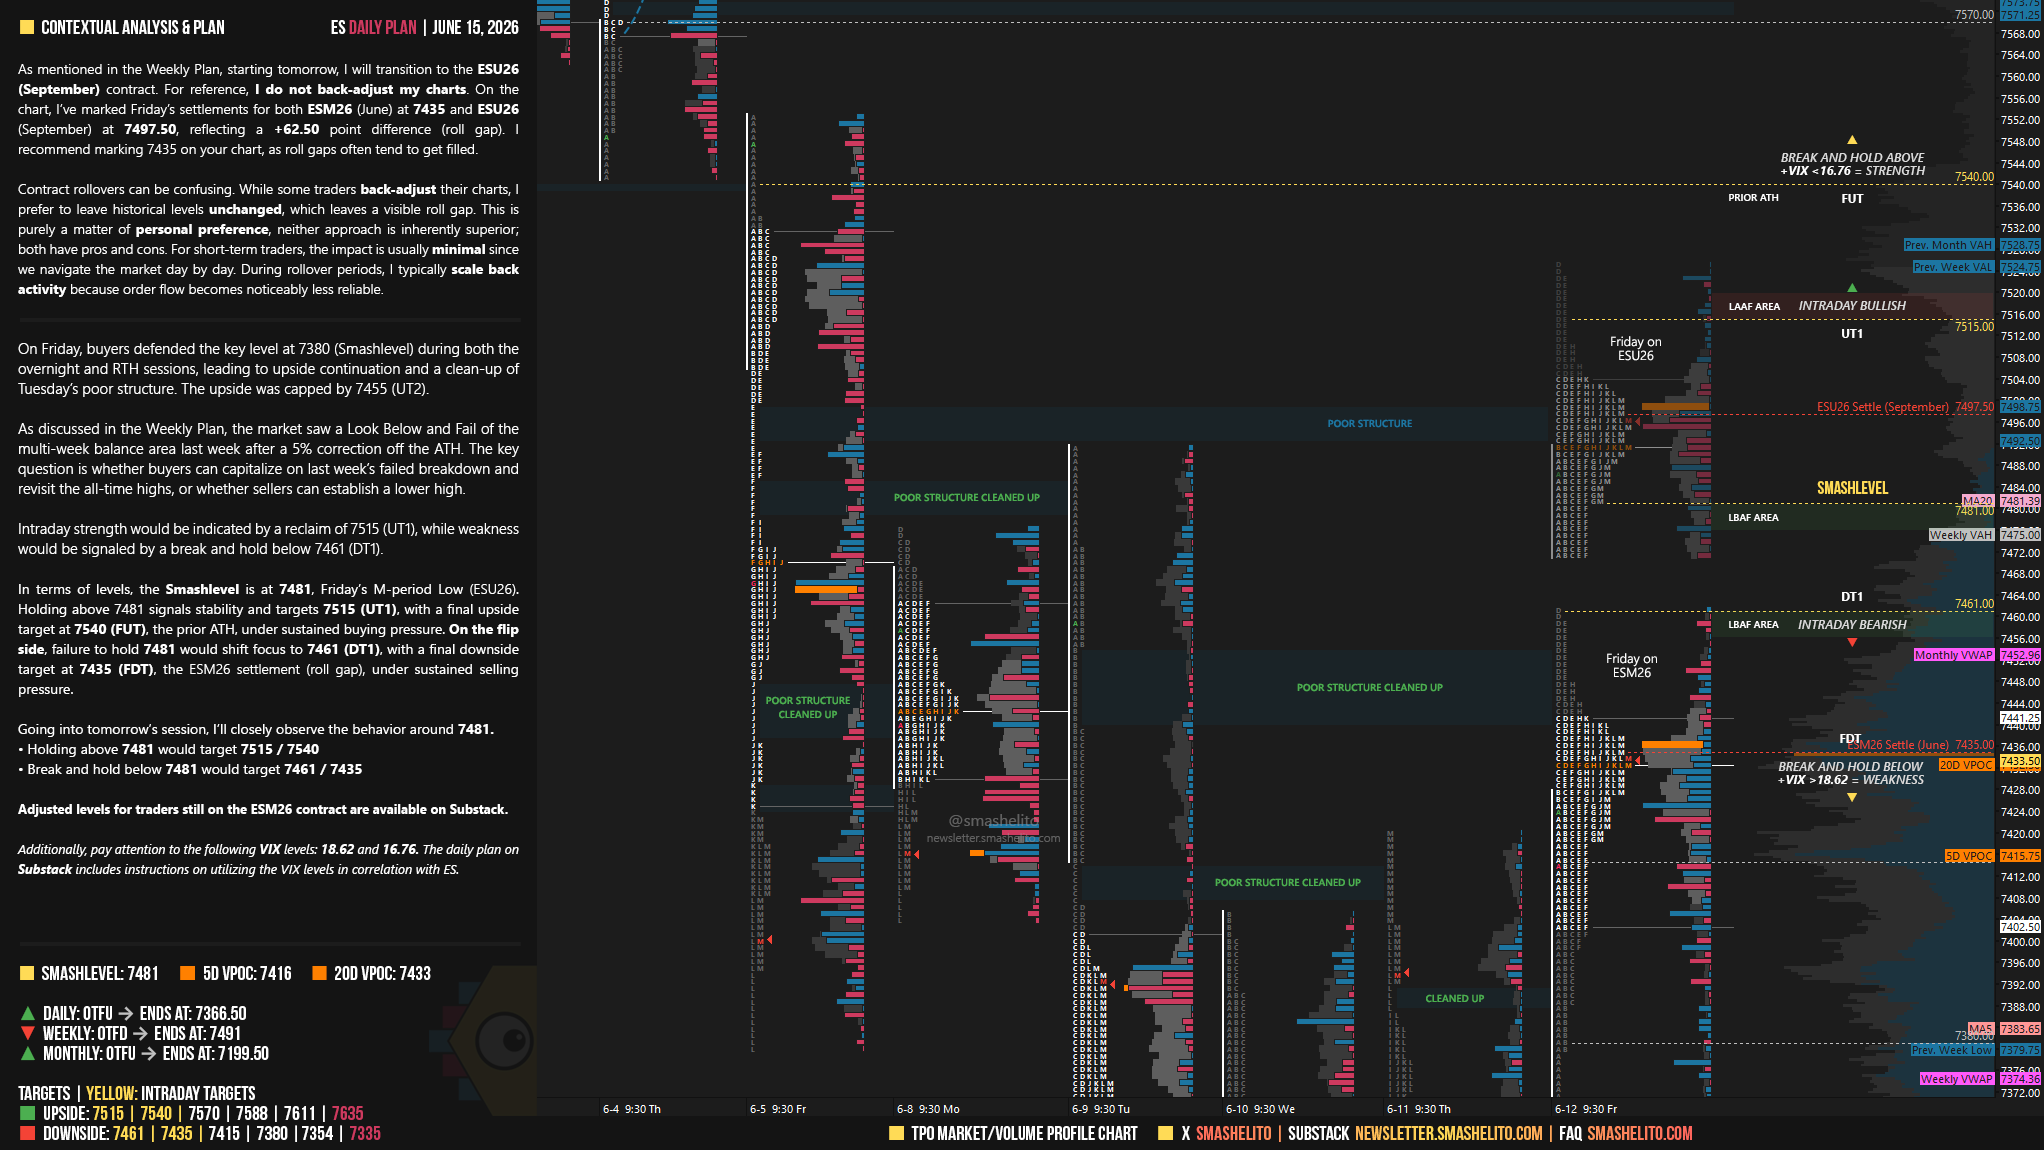
As mentioned in the Weekly Plan, starting tomorrow, I will transition to the ESU26 (September) contract.
For reference, I do not back-adjust my charts. On the chart, I’ve marked Friday’s settlements for both ESM26 (June) at 7435 and ESU26 (September) at 7497.50, reflecting a +62.50 point difference (roll gap).
I recommend marking 7435 on your chart, as roll gaps often tend to get filled.
Contract rollovers can be confusing. While some traders back-adjust their charts, I prefer to leave historical levels unchanged, which leaves a visible roll gap. This is purely a matter of personal preference, neither approach is inherently superior; both have pros and cons.
For short-term traders, the impact is usually minimal since we navigate the market day by day. During rollover periods, I typically scale back activity because order flow becomes noticeably less reliable.
Contextual Analysis & Plan
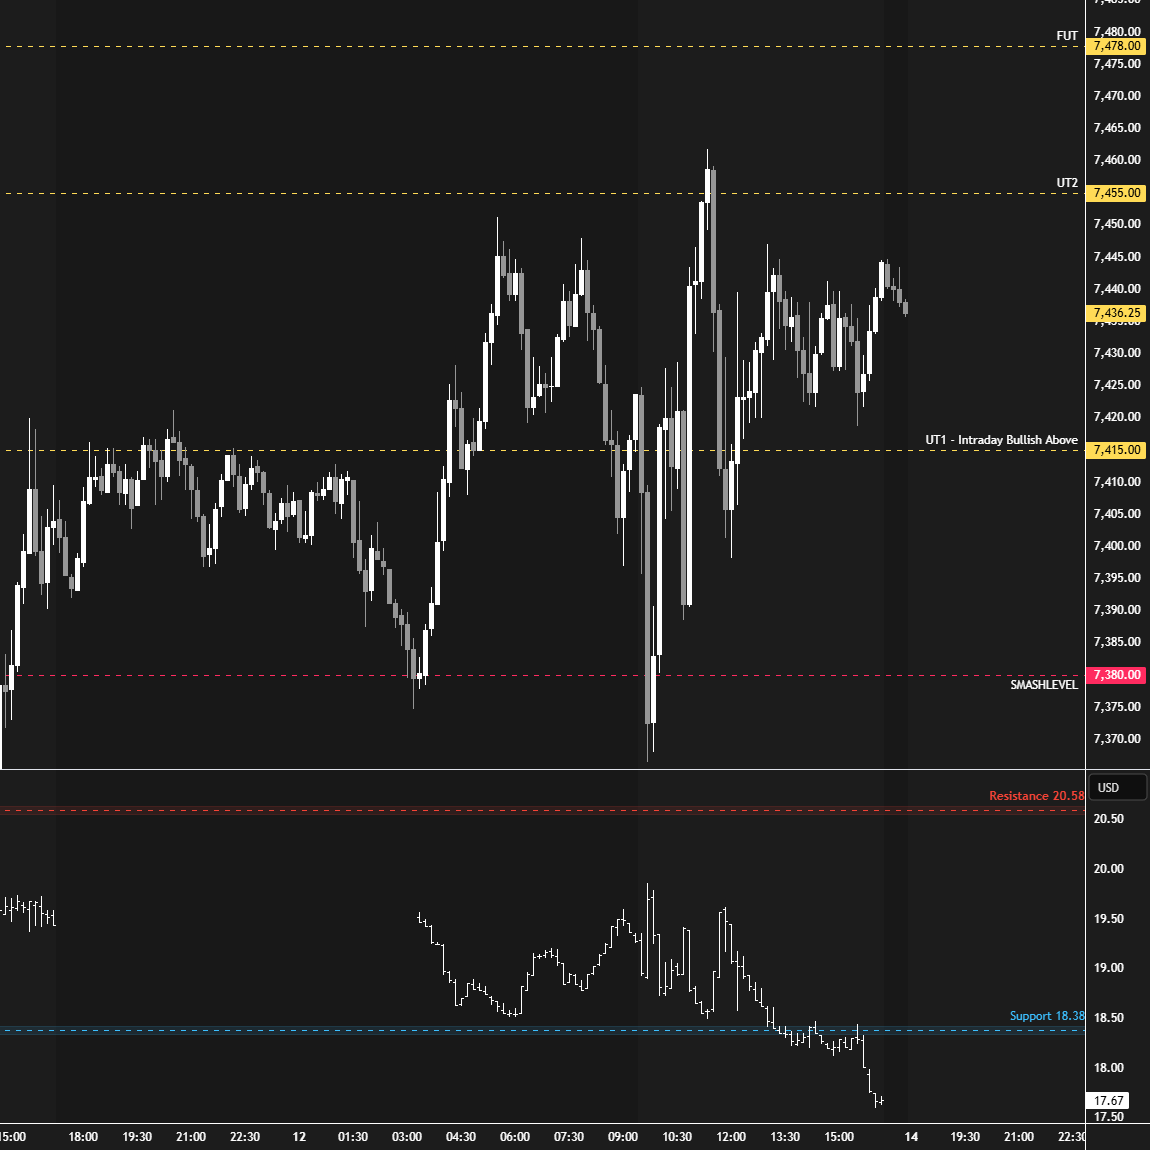
On Friday, buyers defended the key level at 7380 (Smashlevel) during both the overnight and RTH sessions, leading to upside continuation and a clean-up of Tuesday’s poor structure. The upside was capped by 7455 (UT2).
Smashlevels Recap
As discussed in the Weekly Plan, the market saw a Look Below and Fail of the multi-week balance area last week after a 5% correction off the ATH. The key question is whether buyers can capitalize on last week’s failed breakdown and revisit the all-time highs, or whether sellers can establish a lower high.
Intraday strength would be indicated by a reclaim of 7515 (UT1), while weakness would be signaled by a break and hold below 7461 (DT1).
In terms of levels, the Smashlevel is at 7481, Friday’s M-period Low (ESU26). Holding above 7481 signals stability and targets 7515 (UT1), with a final upside target at 7540 (FUT), the prior ATH, under sustained buying pressure.
On the flip side, failure to hold 7481 would shift focus to 7461 (DT1), with a final downside target at 7435 (FDT), the ESM26 settlement (roll gap), under sustained selling pressure.
Visual Representation
Levels of Interest
Going into tomorrow’s session, I’ll closely observe the behavior around 7481.
Holding above 7481 would target 7515 / 7540
Break and hold below 7481 would target 7461 / 7435
Additionally, pay attention to the following VIX levels: 18.62 and 16.76. These levels can provide confirmation of strength or weakness.
Break and hold above 7540 with VIX below 16.76 would confirm strength.
Break and hold below 7435 with VIX above 18.62 would confirm weakness.
Overall, it's important to exercise caution when trading outside of the highlighted yellow levels. A non-cooperative VIX may suggest possible reversals i.e trade setups.
Adjusted levels for traders still on the ESM26 contract:
Going into tomorrow’s session, I’ll closely observe the behavior around 7419.
Holding above 7419 would target 7453 / 7478
Break and hold below 7419 would target 7399 / 7373
Thanks Smash!
Which software is this its very clean visual and detailed