
ES Daily Plan | June 12, 2026
Market Context & Key Levels for the Day Ahead

— For new subscribers
The yellow levels highlighted at the bottom left of the chart are the primary intraday levels I focus on. To avoid impulsive decisions at poor trade locations, I follow a simple but effective rule: exercise caution when initiating trades outside of these yellow levels.
This means I’m cautious about chasing longs above the Final Upside Target (FUT) and shorts below the Final Downside Target (FDT). It’s important to understand that not chasing does not imply initiating a trade in the opposite direction, discipline over impulse.
Be sure to review the Weekly Plan for a broader perspective, key levels, and market expectations for the week ahead.

Contextual Analysis & Plan
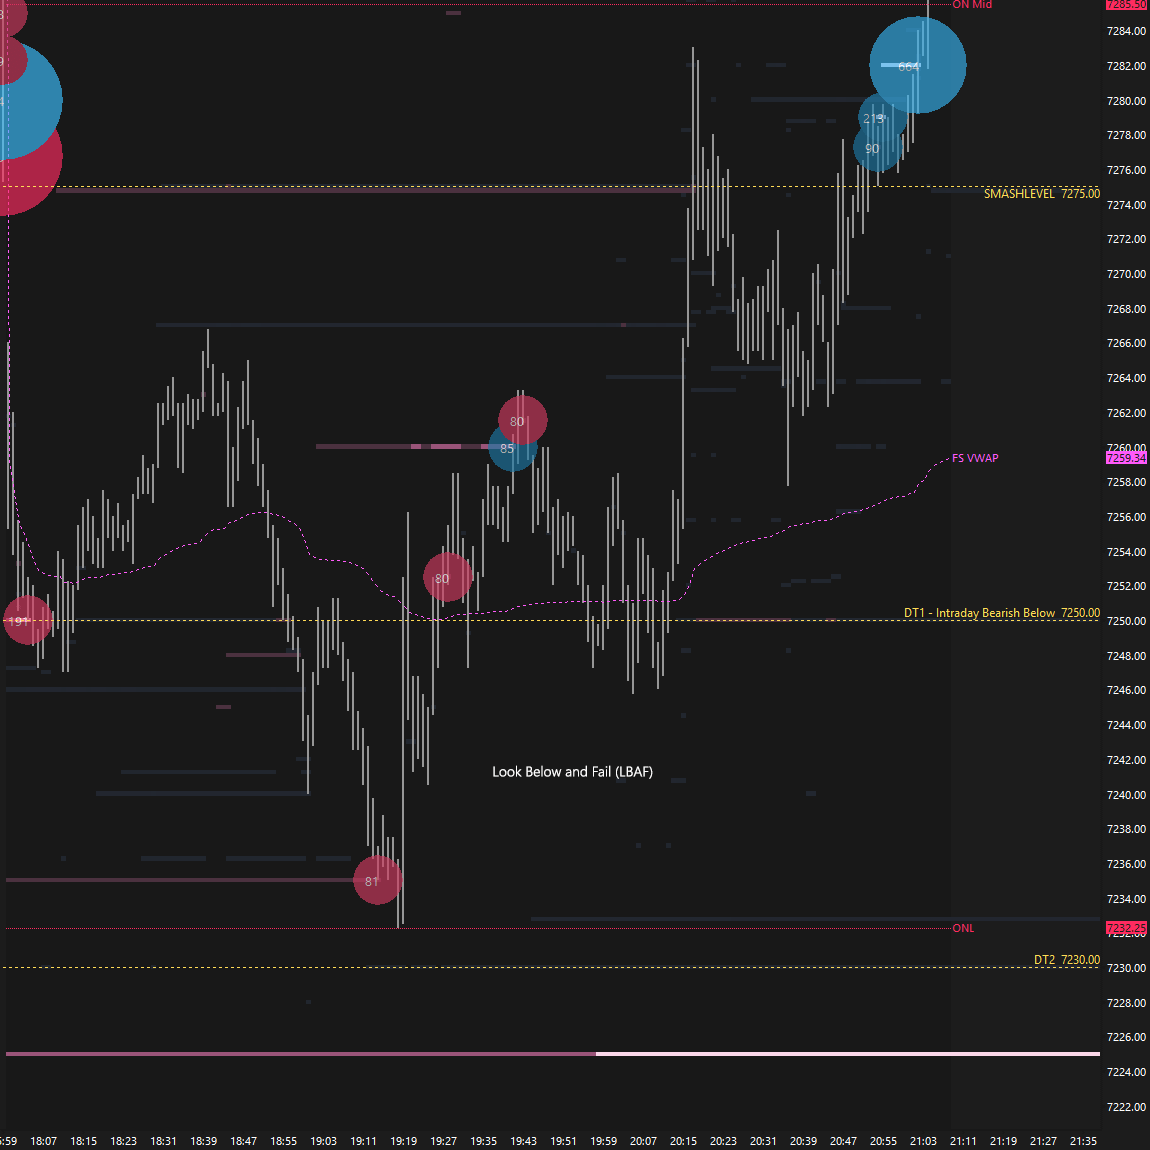
Wednesday’s closing weakness carried into the overnight session, with sellers immediately gaining traction to the downside. As outlined in the plan, a break and hold below 7250 (DT1) would signal weakness, something sellers ultimately struggled with. A perfect Look Below and Fail (LBAF) of 7250, coming a few ticks shy of 7230 (DT2), resulted in a reversal (see Figure 1). The remainder of the overnight session offered excellent reactions around all our key levels, with sellers stepping in at 7335 (UT2), aligning with last month’s VAL.
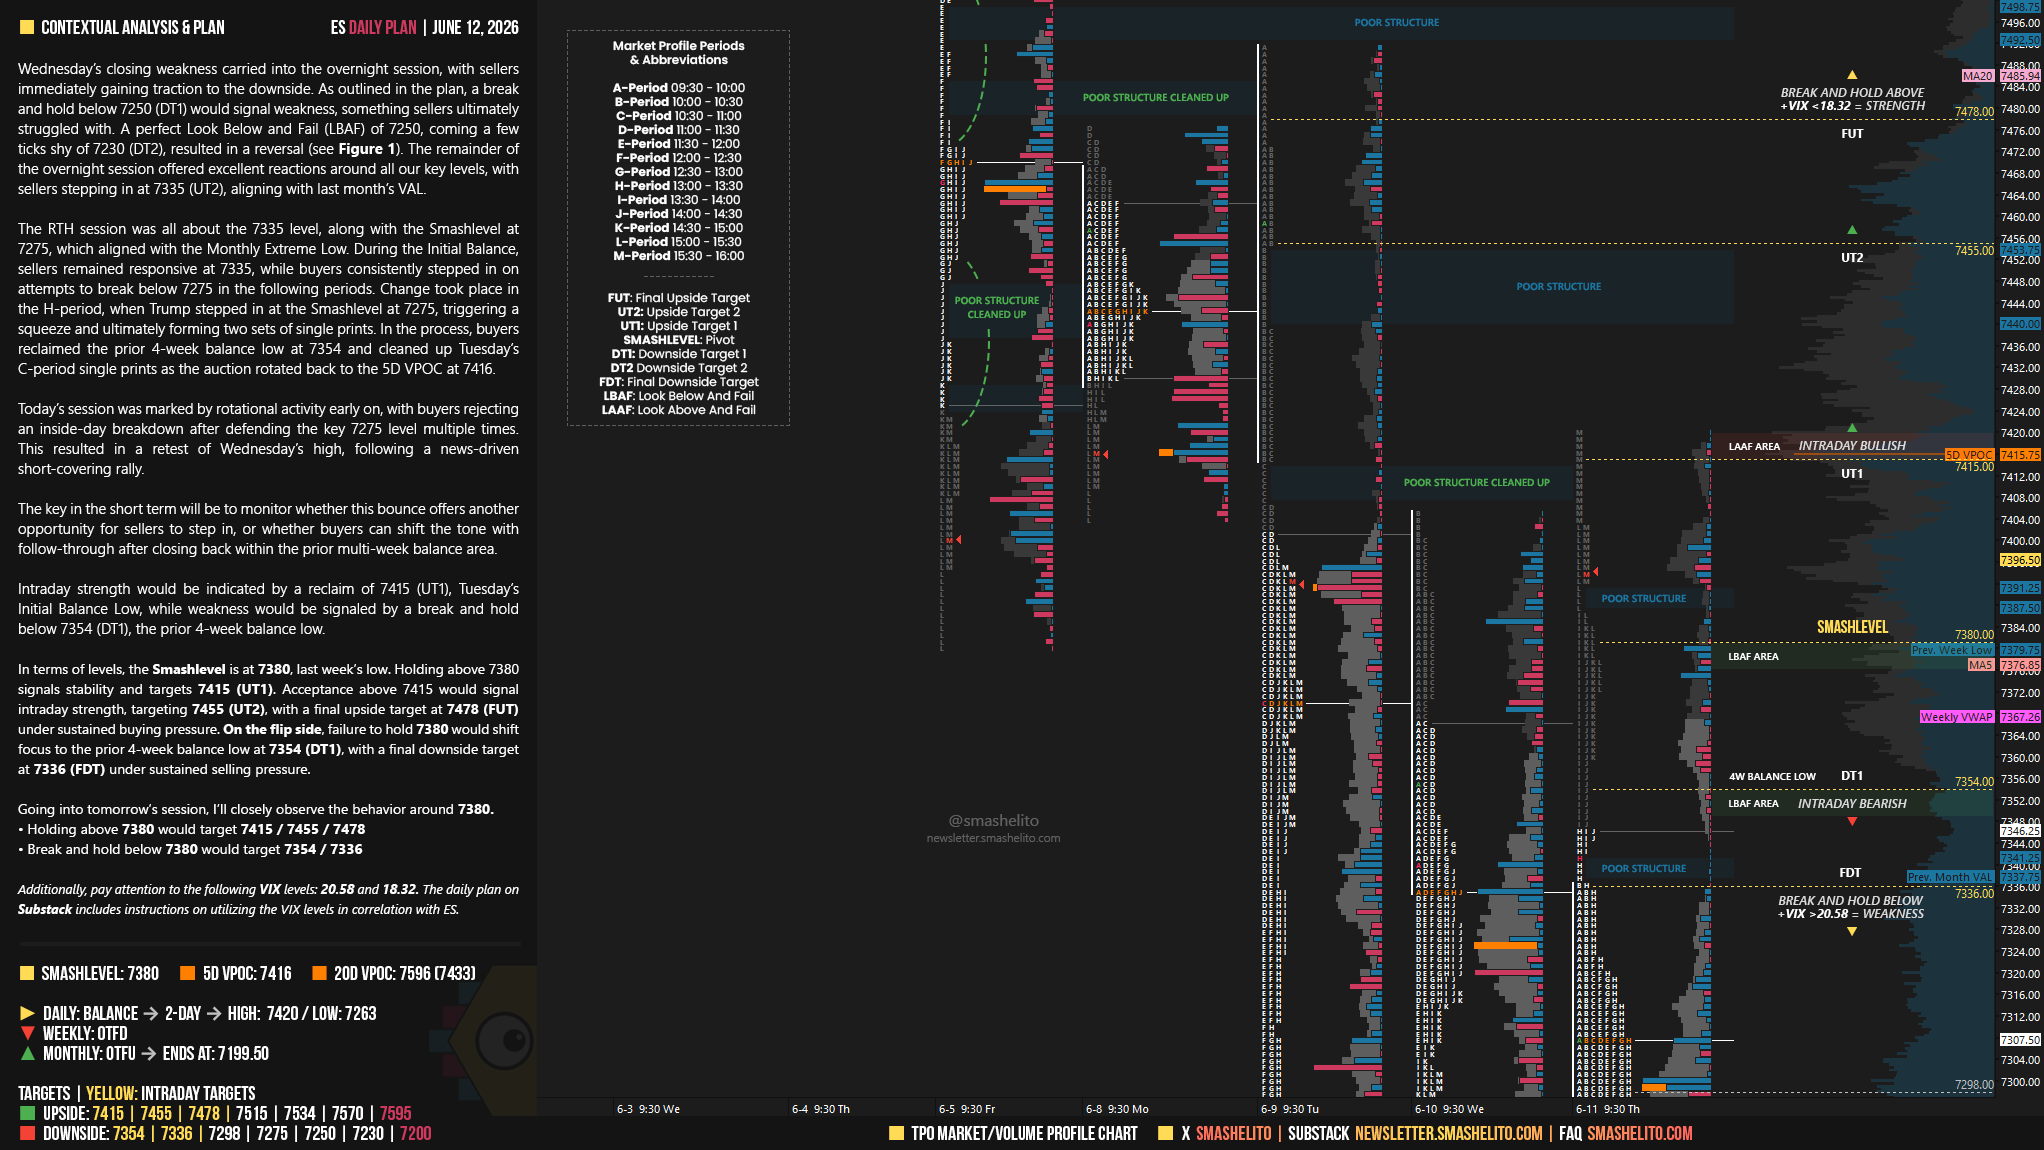
The RTH session was all about the 7335 level, along with the Smashlevel at 7275, which aligned with the Monthly Extreme Low. During the Initial Balance, sellers remained responsive at 7335, while buyers consistently stepped in on attempts to break below 7275 in the following periods. Change took place in the H-period, when Trump stepped in at the Smashlevel at 7275, triggering a squeeze and ultimately forming two sets of single prints. In the process, buyers reclaimed the prior 4-week balance low at 7354 and cleaned up Tuesday’s C-period single prints as the auction rotated back to the 5D VPOC at 7416.
Smashlevels Recap
Today’s session was marked by rotational activity early on, with buyers rejecting an inside-day breakdown after defending the key 7275 level multiple times. This resulted in a retest of Wednesday’s high, following a news-driven short-covering rally.
The key in the short term will be to monitor whether this bounce offers another opportunity for sellers to step in, or whether buyers can shift the tone with follow-through after closing back within the prior multi-week balance area.
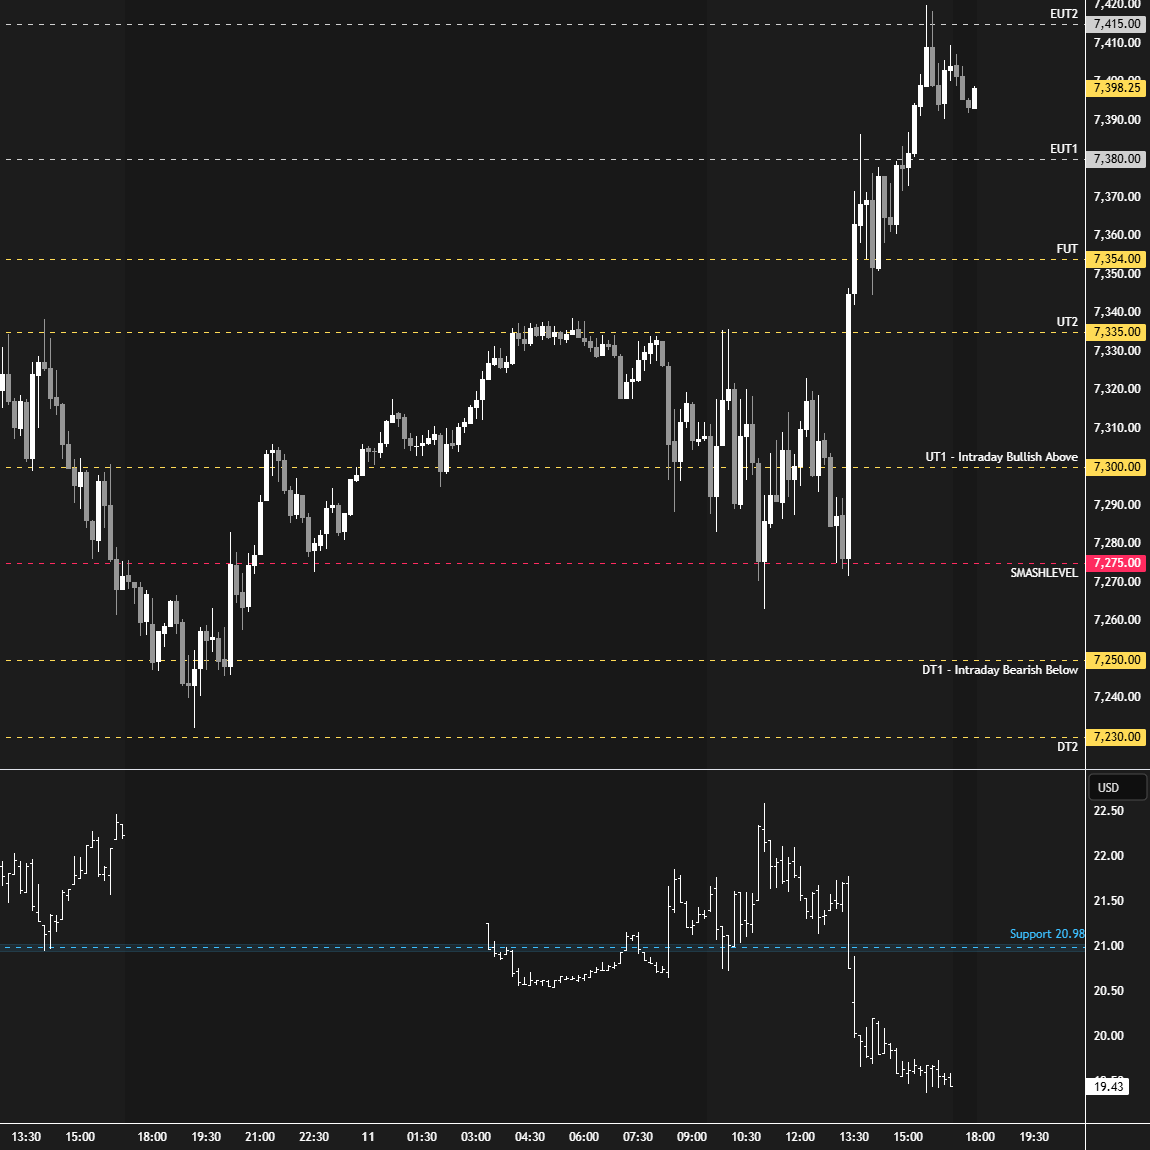
Intraday strength would be indicated by a reclaim of 7415 (UT1), Tuesday’s Initial Balance Low, while weakness would be signaled by a break and hold below 7354 (DT1), the prior 4-week balance low.
In terms of levels, the Smashlevel is at 7380, last week’s low. Holding above 7380 signals stability and targets 7415 (UT1). Acceptance above 7415 would signal intraday strength, targeting 7455 (UT2), with a final upside target at 7478 (FUT) under sustained buying pressure.
On the flip side, failure to hold 7380 would shift focus to the prior 4-week balance low at 7354 (DT1), with a final downside target at 7336 (FDT) under sustained selling pressure.
Visual Representation
Levels of Interest
Going into tomorrow’s session, I’ll closely observe the behavior around 7380.
Holding above 7380 would target 7415 / 7455 / 7478
Break and hold below 7380 would target 7354 / 7336
Additionally, pay attention to the following VIX levels: 20.58 and 18.32. These levels can provide confirmation of strength or weakness.
Break and hold above 7478 with VIX below 18.32 would confirm strength.
Break and hold below 7336 with VIX above 20.58 would confirm weakness.
Overall, it's important to exercise caution when trading outside of the highlighted yellow levels. A non-cooperative VIX may suggest possible reversals i.e trade setups.
Thank you!
Smashelito level was given