
ES Daily Plan | July 31, 2025
Market Context & Key Levels for the Day Ahead

— For new subscribers
The yellow levels highlighted at the bottom left of the chart are the primary intraday levels I focus on. To avoid impulsive decisions at poor trade locations, I follow a simple but effective rule: exercise caution when initiating trades outside of these yellow levels.
This means I’m cautious about chasing longs above the Final Upside Target (FUT) and shorts below the Final Downside Target (FDT). It’s important to understand that not chasing does not imply initiating a trade in the opposite direction — discipline over impulse.
Be sure to review the ES Weekly Plan | July 28 - August 1, 2025 for a broader perspective, key levels, and market expectations for the week ahead.
Contextual Analysis & Plan
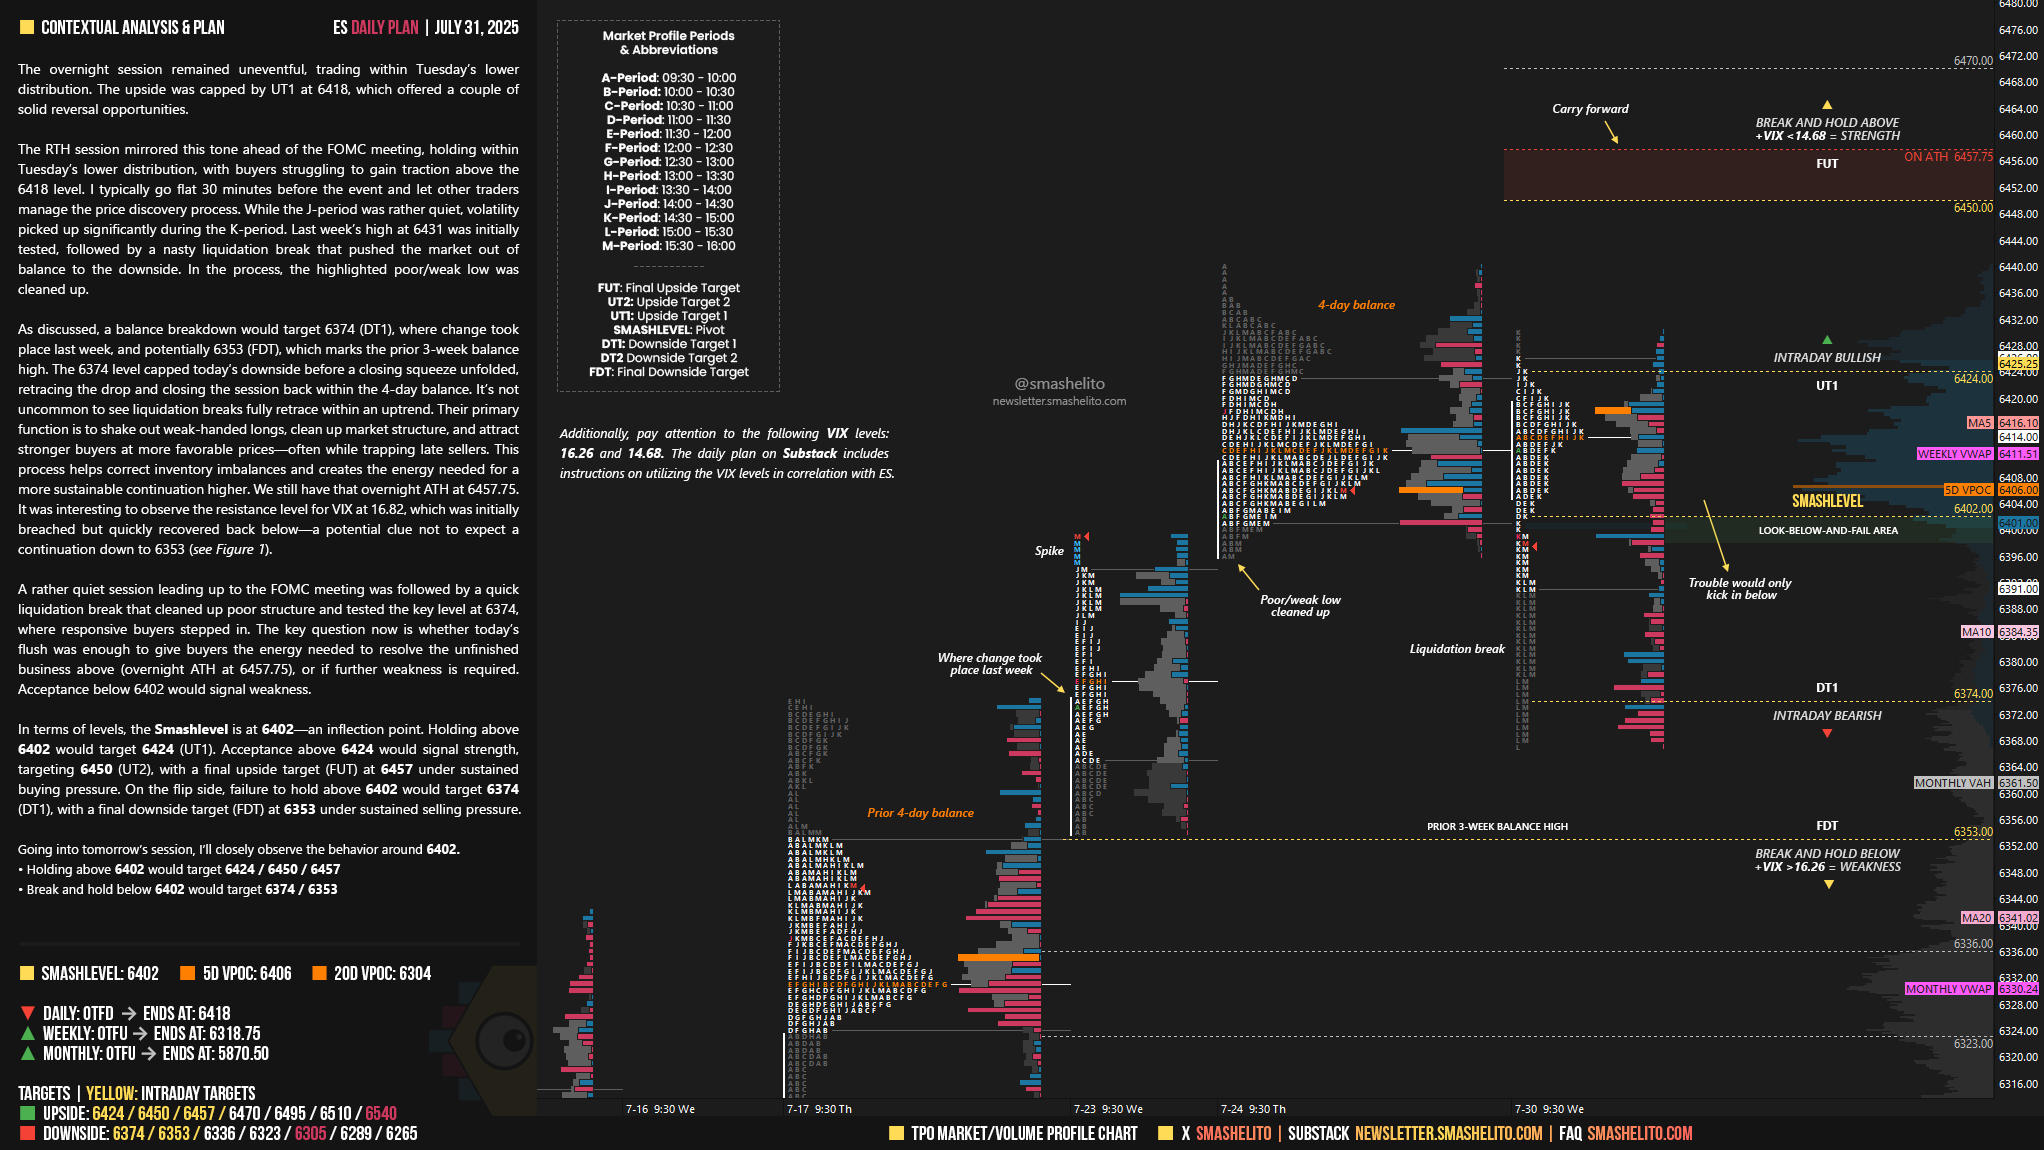
The overnight session remained uneventful, trading within Tuesday’s lower distribution. The upside was capped by UT1 at 6418, which offered a couple of solid reversal opportunities.
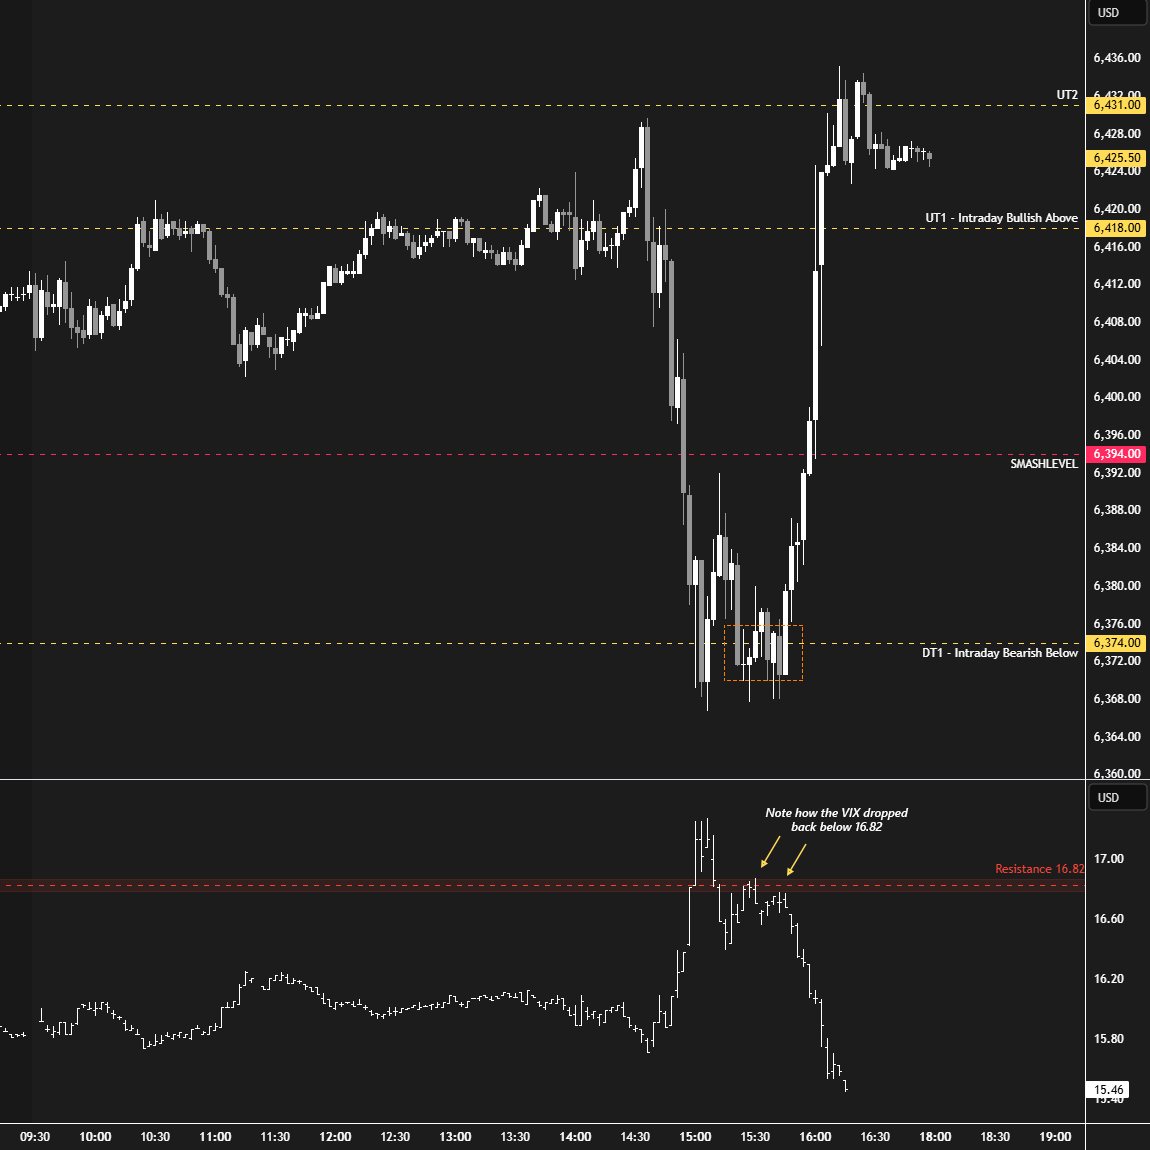
The RTH session mirrored this tone ahead of the FOMC meeting, holding within Tuesday’s lower distribution, with buyers struggling to gain traction above the 6418 level. I typically go flat 30 minutes before the event and let other traders manage the price discovery process. While the J-period was rather quiet, volatility picked up significantly during the K-period. Last week’s high at 6431 was initially tested, followed by a nasty liquidation break that pushed the market out of balance to the downside. In the process, the highlighted poor/weak low was cleaned up.
As discussed, a balance breakdown would target 6374 (DT1), where change took place last week, and potentially 6353 (FDT), which marks the prior 3-week balance high. The 6374 level capped today’s downside before a closing squeeze unfolded, retracing the drop and closing the session back within the 4-day balance. It’s not uncommon to see liquidation breaks fully retrace within an uptrend. Their primary function is to shake out weak-handed longs, clean up market structure, and attract stronger buyers at more favorable prices—often while trapping late sellers. This process helps correct inventory imbalances and creates the energy needed for a more sustainable continuation higher. We still have that overnight ATH at 6457.75. It was interesting to observe the resistance level for VIX at 16.82, which was initially breached but quickly recovered back below—a potential clue not to expect a continuation down to 6353 (see Figure 1).
A rather quiet session leading up to the FOMC meeting was followed by a quick liquidation break that cleaned up poor structure and tested the key level at 6374, where responsive buyers stepped in. The key question now is whether today’s flush was enough to give buyers the energy needed to resolve the unfinished business above (overnight ATH at 6457.75), or if further weakness is required. Acceptance below 6402 would signal weakness.
In terms of levels, the Smashlevel is at 6402—an inflection point. Holding above 6402 would target 6424 (UT1). Acceptance above 6424 would signal strength, targeting 6450 (UT2), with a final upside target (FUT) at 6457 under sustained buying pressure.
On the flip side, failure to hold above 6402 would target 6374 (DT1), with a final downside target (FDT) at 6353 under sustained selling pressure.
Levels of Interest
Going into tomorrow’s session, I’ll closely observe the behavior around 6402.
Holding above 6402 would target 6424 / 6450 / 6457
Break and hold below 6402 would target 6374 / 6353
Additionally, pay attention to the following VIX levels: 16.26 and 14.68. These levels can provide confirmation of strength or weakness.
Break and hold above 6457 with VIX below 14.68 would confirm strength.
Break and hold below 6353 with VIX above 16.26 would confirm weakness.
Overall, it's important to exercise caution when trading outside of the highlighted yellow levels. A non-cooperative VIX may suggest possible reversals i.e trade setups.
Thank you! What a day today.
Thank you Smash!