ES Daily Plan | July 31, 2024
My preparations and expectations for the upcoming session.
For new followers: the yellow levels highlighted at the bottom are the primary levels that I focus on intraday. My strategy for preventing impulsive decisions at unfavorable locations involves following a simple yet effective rule of exercising caution when initiating trades outside of the yellow levels. This implies that I am cautious chasing longs above the final yellow upside target and shorts below the final yellow downside target. It is crucial to understand that refraining from chasing a trade is not an automatic invitation to initiate a trade in the opposite direction.
Visual Representation
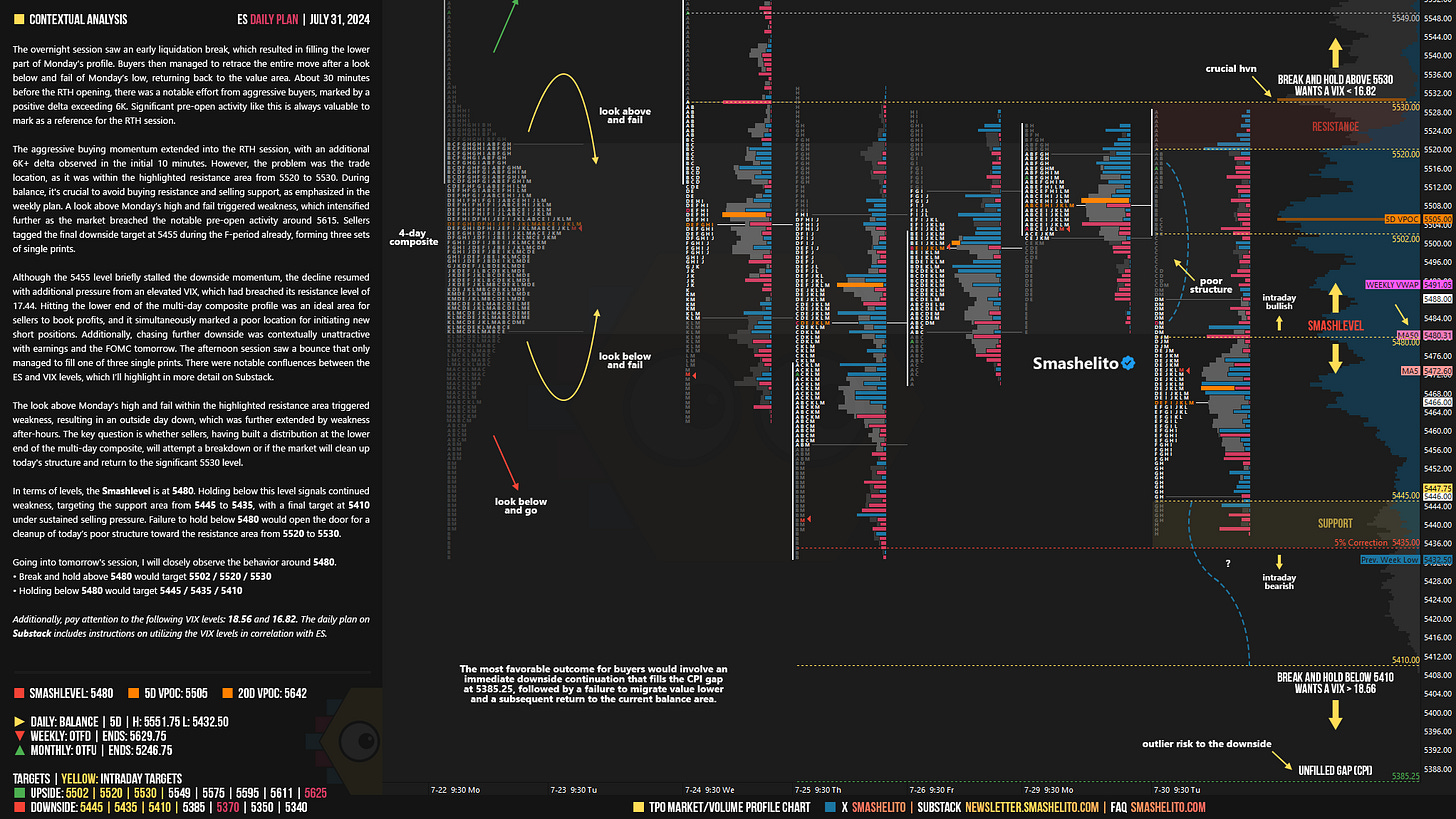
Contextual Analysis
The overnight session saw an early liquidation break, which resulted in filling the lower part of Monday's profile. Buyers then managed to retrace the entire move after a look below and fail of Monday’s low, returning back to the value area. About 30 minutes before the RTH opening, there was a notable effort from aggressive buyers, marked by a positive delta exceeding 6K. Significant pre-open activity like this is always valuable to mark as a reference for the RTH session.
The aggressive buying momentum extended into the RTH session, with an additional 6K+ delta observed in the initial 10 minutes. However, the problem was the trade location, as it was within the highlighted resistance area from 5520 to 5530. During balance, it's crucial to avoid buying resistance and selling support, as emphasized in the weekly plan. A look above Monday’s high and fail triggered weakness, which intensified further as the market breached the notable pre-open activity around 5615. Sellers tagged the final downside target at 5455 during the F-period already, forming three sets of single prints.
Although the 5455 level briefly stalled the downside momentum, the decline resumed with additional pressure from an elevated VIX, which had breached its resistance level of 17.44. Hitting the lower end of the multi-day composite profile was an ideal area for sellers to book profits, and it simultaneously marked a poor location for initiating new short positions. Additionally, chasing further downside was contextually unattractive with earnings and the FOMC tomorrow. The afternoon session saw a bounce that only managed to fill one of three single prints. There were notable confluences between the ES and VIX levels, which I’ll highlight in more detail on Substack.
The look above Monday’s high and fail within the highlighted resistance area triggered weakness, resulting in an outside day down, which was further extended by weakness after-hours. The key question is whether sellers, having built a distribution at the lower end of the multi-day composite, will attempt a breakdown or if the market will clean up today's structure and return to the significant 5530 level.
In terms of levels, the Smashlevel is at 5480. Holding below this level signals continued weakness, targeting the support area from 5445 to 5435, with a final target at 5410 under sustained selling pressure. Failure to hold below 5480 would open the door for a cleanup of today’s poor structure toward the resistance area from 5520 to 5530.
Levels of Interest
Going into tomorrow's session, I will closely observe the behavior around 5480.
Break and hold above 5480 would target 5502 / 5520 / 5530
Holding below 5480 would target 5445 / 5435 / 5410
Additionally, pay attention to the following VIX levels: 18.56 and 16.82. These levels can provide confirmation of strength or weakness.
Break and hold above 5530 with VIX below 16.82 would confirm strength.
Break and hold below 5410 with VIX above 18.56 would confirm weakness.
Overall, it's important to exercise caution when trading outside of the highlighted yellow levels. A non-cooperative VIX may suggest possible reversals i.e trade setups.
Weekly Plan
Make sure to review the Weekly Plan, which provides a broader perspective and highlights key levels of interest to observe in the upcoming week.
Disclaimer: Futures and options trading involves a high level of risk, with the potential for substantial losses. The information provided in this newsletter is for informational purposes only and is not intended to be a trade recommendation. It is the responsibility of the reader to make their own investment decisions and they should seek the advice of a qualified securities professional before making any investments. The owners/authors of this newsletter are not certified as registered financial professionals or investment advisers.


I am surprised you didn't mention that 5437.50 was June Contract settlement price , which I always take your advice and had marked on my chart as you have said these roll gaps get filled many times
We overshot by 4 pts and now a 95 pt rally off it
Great Stuff
Great stuff as always!!