

— For new subscribers
The yellow levels highlighted at the bottom left of the chart are the primary intraday levels I focus on. To avoid impulsive decisions at poor trade locations, I follow a simple but effective rule: exercise caution when initiating trades outside of these yellow levels.
This means I’m cautious about chasing longs above the Final Upside Target (FUT) and shorts below the Final Downside Target (FDT). It’s important to understand that not chasing does not imply initiating a trade in the opposite direction. Discipline over impulse.
Be sure to review the Weekly Plan for a broader perspective, key levels, and market expectations for the week ahead.

Contextual Analysis & Plan
Quick Update: Monday’s session closed at the upper end of its lower distribution. During the overnight session, the auction traversed that lower distribution, testing Monday’s VAL at 7425 (DT1), a level that ultimately proved pivotal during today’s session. A Look Below and Fail (LBAF) of 7425 triggered a rotation back toward 7458 (Smashlevel) during the Euro session.
An attempt to reclaim 7458 ahead of the RTH open failed after finding responsive sellers within Monday’s B-period single prints. This resulted in a Look Above and Fail (LAAF) of 7458, with the reversal gaining momentum once the RTH session opened. During the Initial Balance (the first 60 minutes of RTH, consisting of A and B periods), the downside was capped by the 7425 level, which provided another solid LBAF setup.
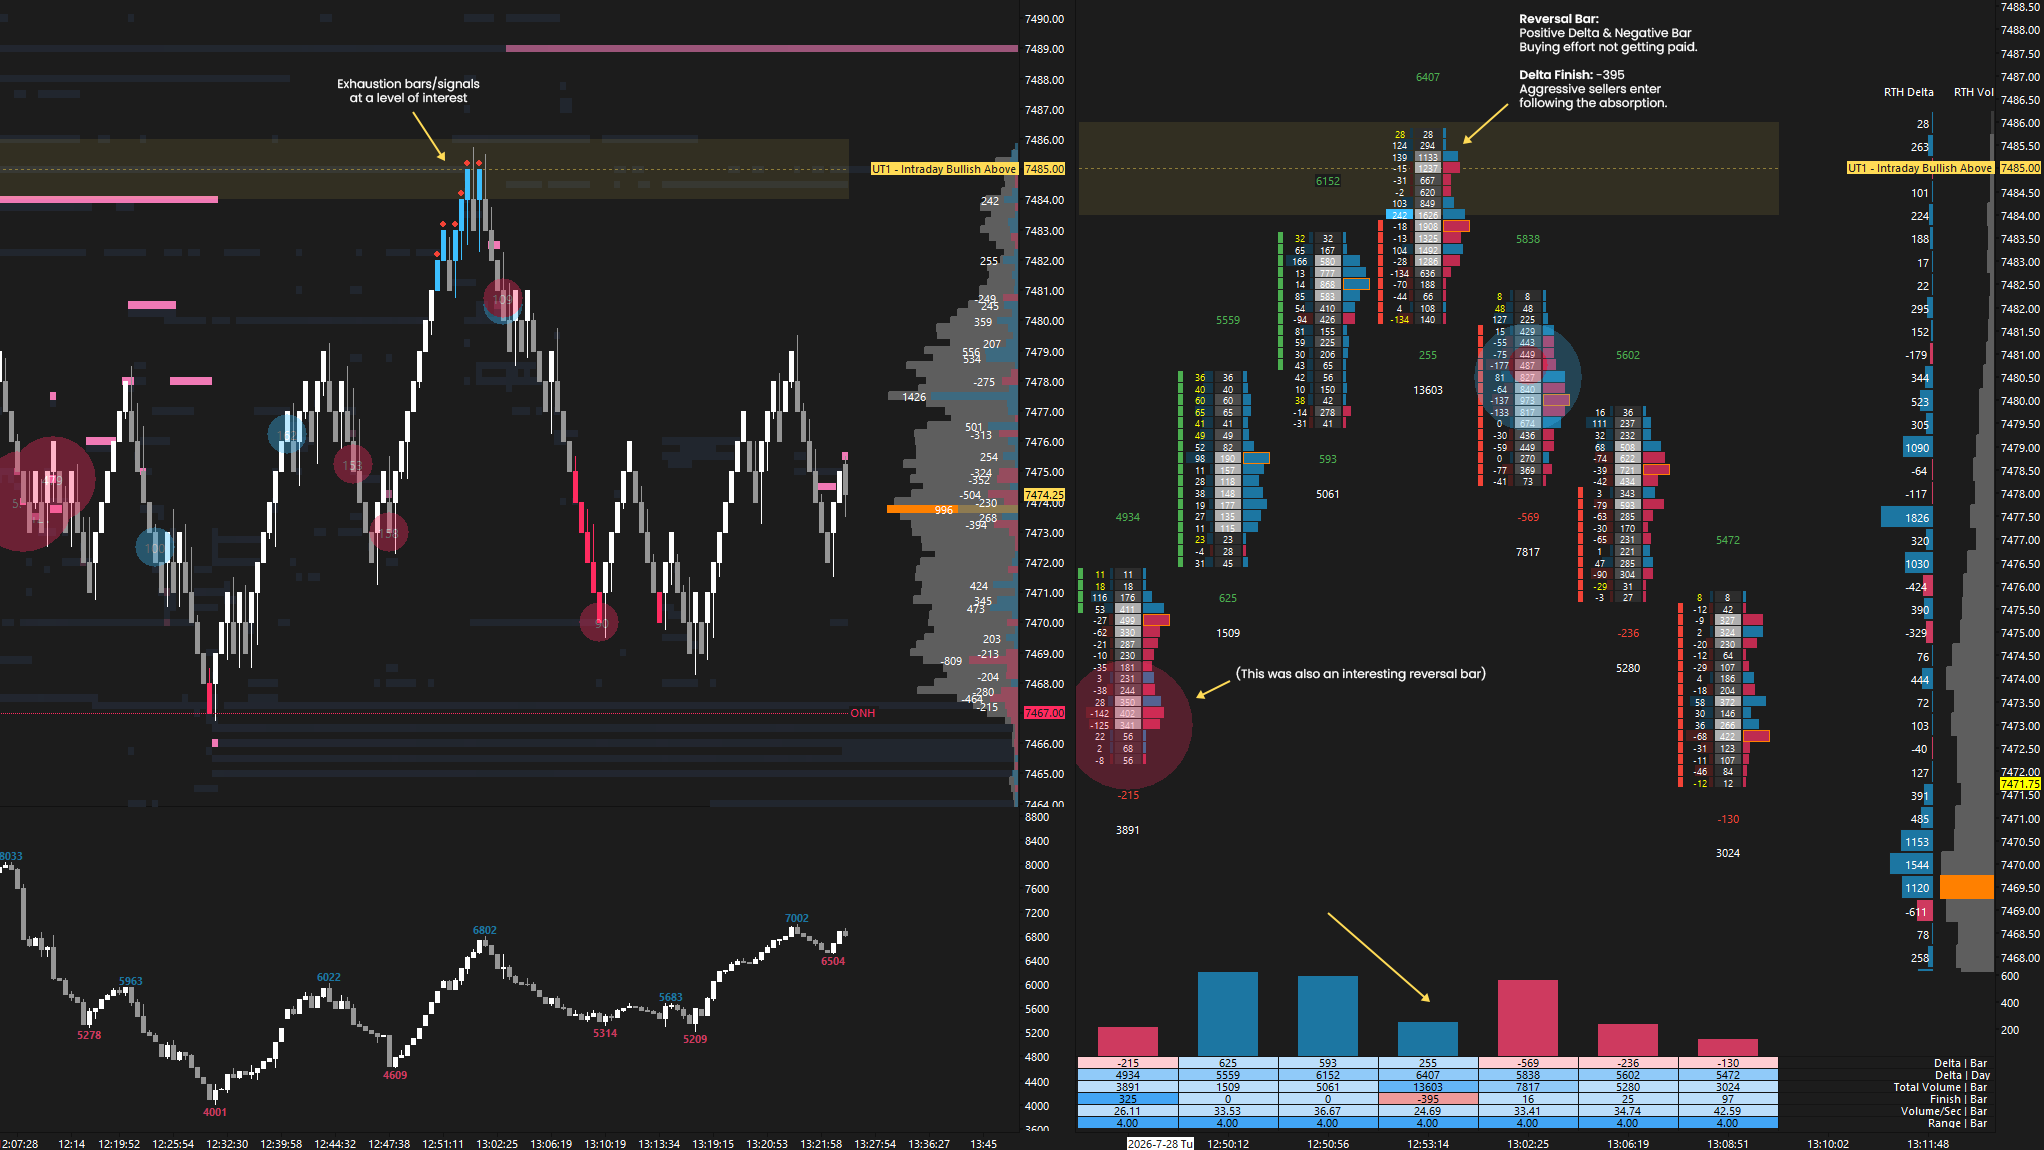
The D-period cleaned up Monday’s single prints while forming a set of its own, which ultimately remained unfilled, effectively creating a double distribution profile for today’s session. Today’s upside was capped by 7485 (UT1), from which a reversal unfolded during the G-period. This reversal was particularly interesting from an order flow perspective (see Figure 1).
Session Recap
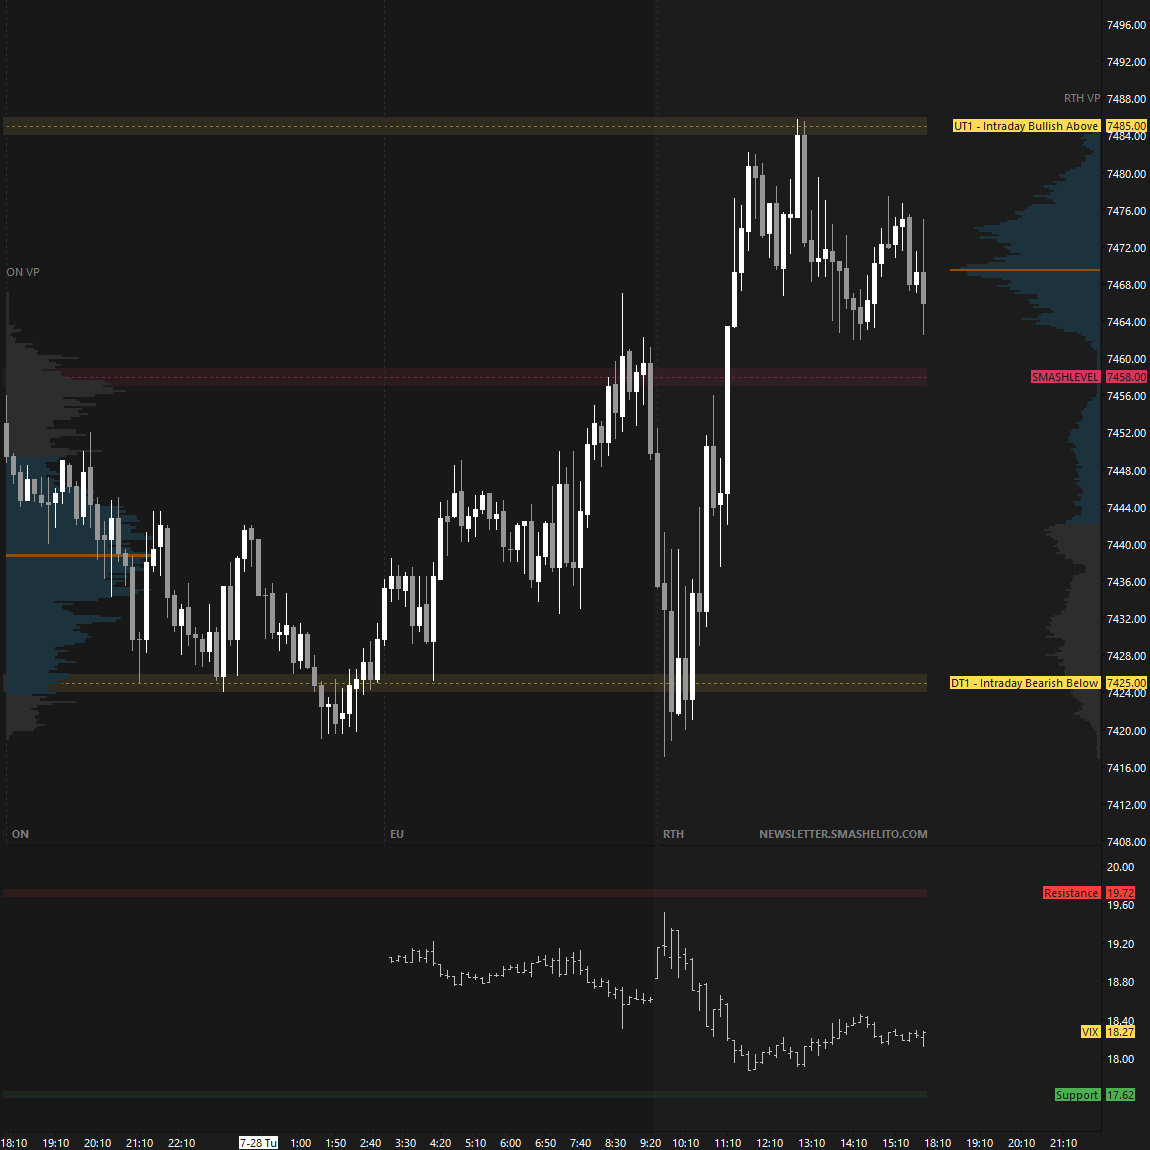
Monday’s trend day down was followed by a double distribution trend day higher today, with D-period single prints separating the two distributions. The single-print area also marks a low volume node (LVN) within the current 4-day balance area.
The auction remains in a state of short-term balance as it awaits additional market-generated information. FOMC is on deck tomorrow, serving as a potential catalyst.
Intraday strength would be indicated by a reclaim of 7485 (UT1), while weakness would be signaled by a break and hold below 7426 (DT1).
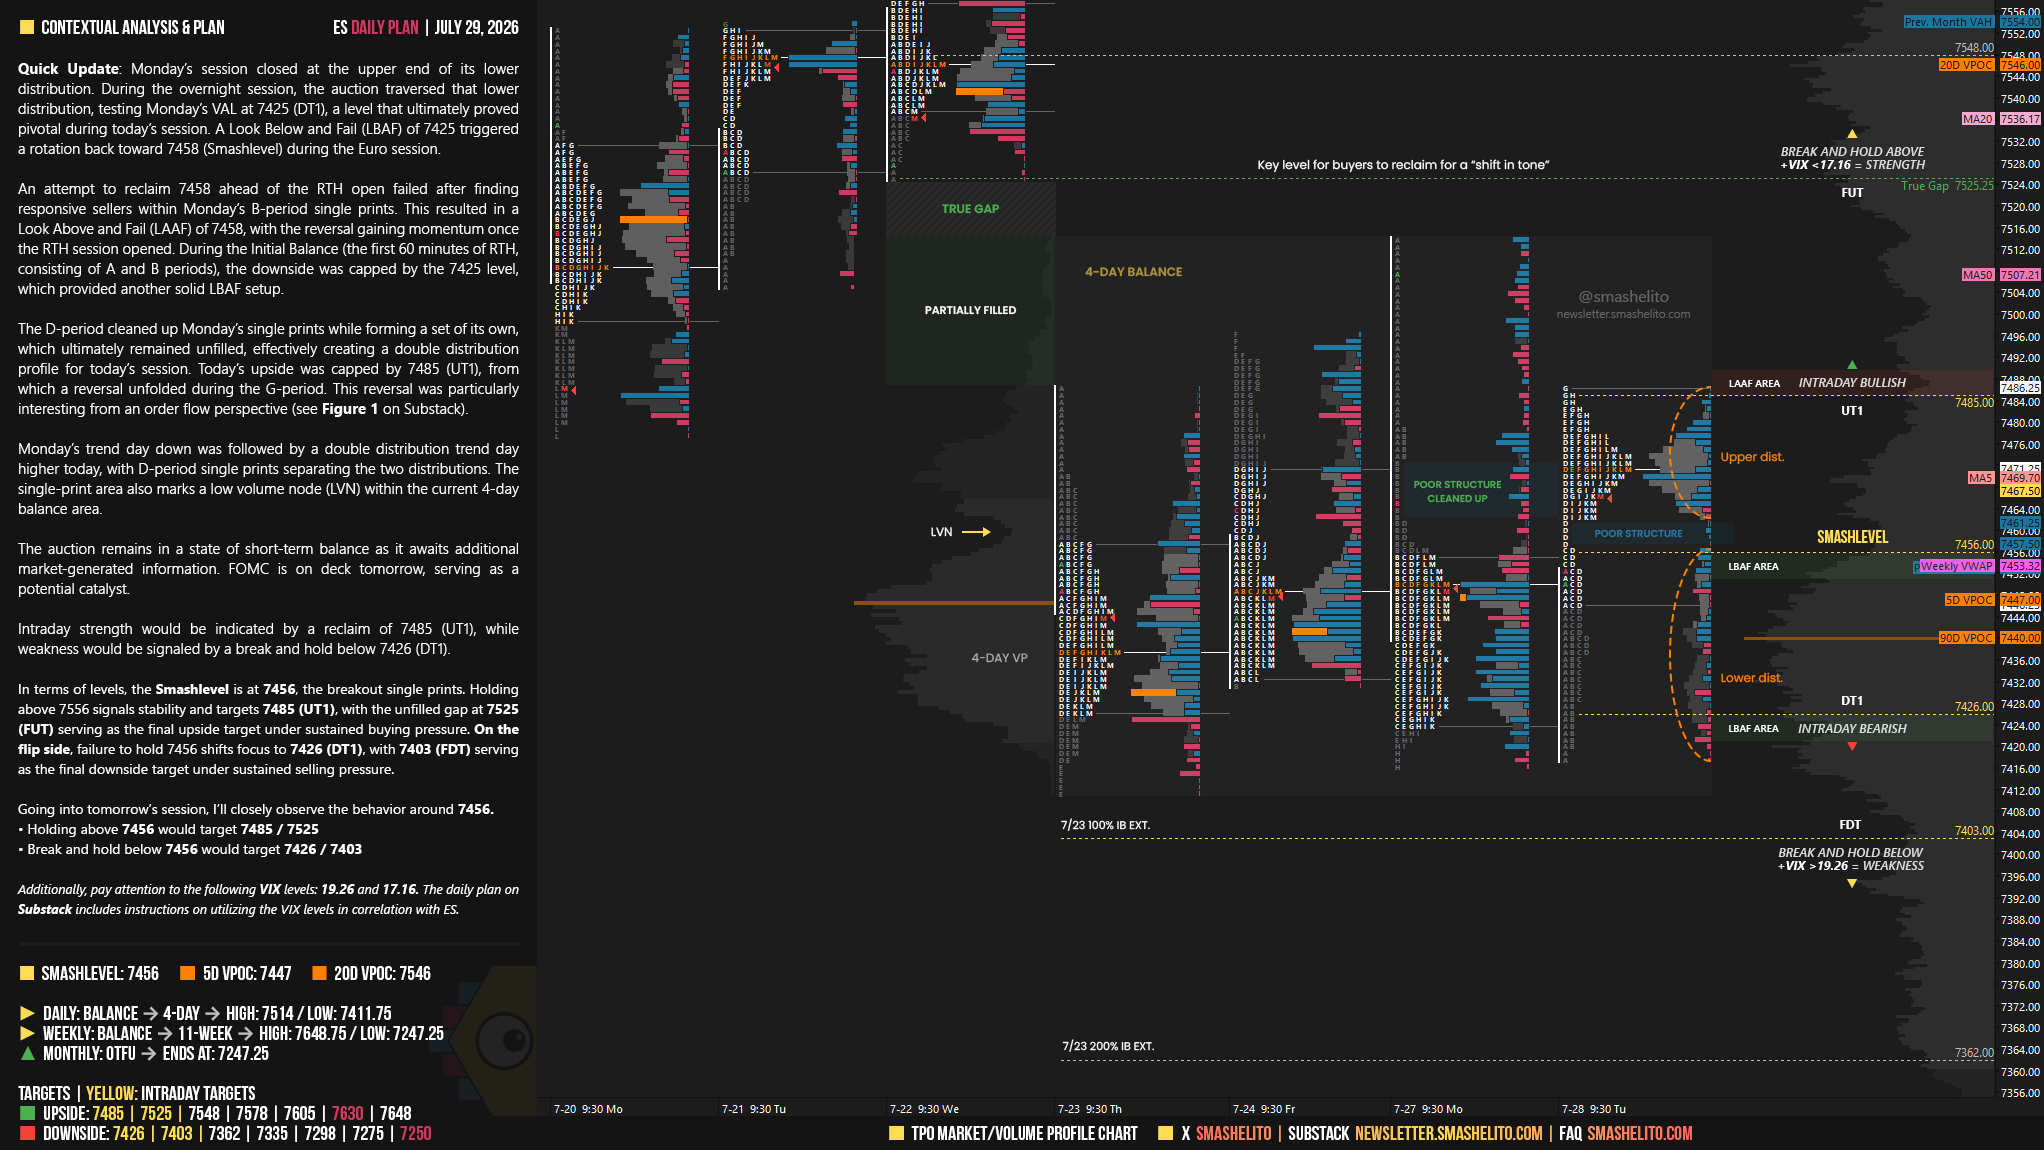
In terms of levels, the Smashlevel is at 7456, the breakout single prints. Holding above 7556 signals stability and targets 7485 (UT1), with the unfilled gap at 7525 (FUT) serving as the final upside target under sustained buying pressure.
On the flip side, failure to hold 7456 shifts focus to 7426 (DT1), with 7403 (FDT) serving as the final downside target under sustained selling pressure.
Visual Representation
Levels of Interest
Going into tomorrow’s session, I’ll closely observe the behavior around 7456.
Holding above 7456 would target 7485 / 7525
Break and hold below 7456 would target 7425 / 7403
Additionally, pay attention to the following VIX levels: 19.26 and 17.16 These levels can provide confirmation of strength or weakness.
Break and hold above 7525 with VIX below 17.16 would confirm strength.
Break and hold below 7403 with VIX above 19.26 would confirm weakness.
Overall, it's important to exercise caution when trading outside of the highlighted yellow levels. A non-cooperative VIX may suggest possible reversals i.e trade setups.
Thanks Smash! Love the visuals!
You could really quit trading and dedicate yourself to art with that infographic.
Thanks for everything, Smash, have a great session!