
ES Daily Plan | July 29, 2025
Market Context & Key Levels for the Day Ahead

— For new subscribers
The yellow levels highlighted at the bottom left of the chart are the primary intraday levels I focus on. To avoid impulsive decisions at poor trade locations, I follow a simple but effective rule: exercise caution when initiating trades outside of these yellow levels.
This means I’m cautious about chasing longs above the Final Upside Target (FUT) and shorts below the Final Downside Target (FDT). It’s important to understand that not chasing does not imply initiating a trade in the opposite direction — discipline over impulse.
Be sure to review the ES Weekly Plan | July 28 - August 1, 2025 for a broader perspective, key levels, and market expectations for the week ahead.
Contextual Analysis & Plan
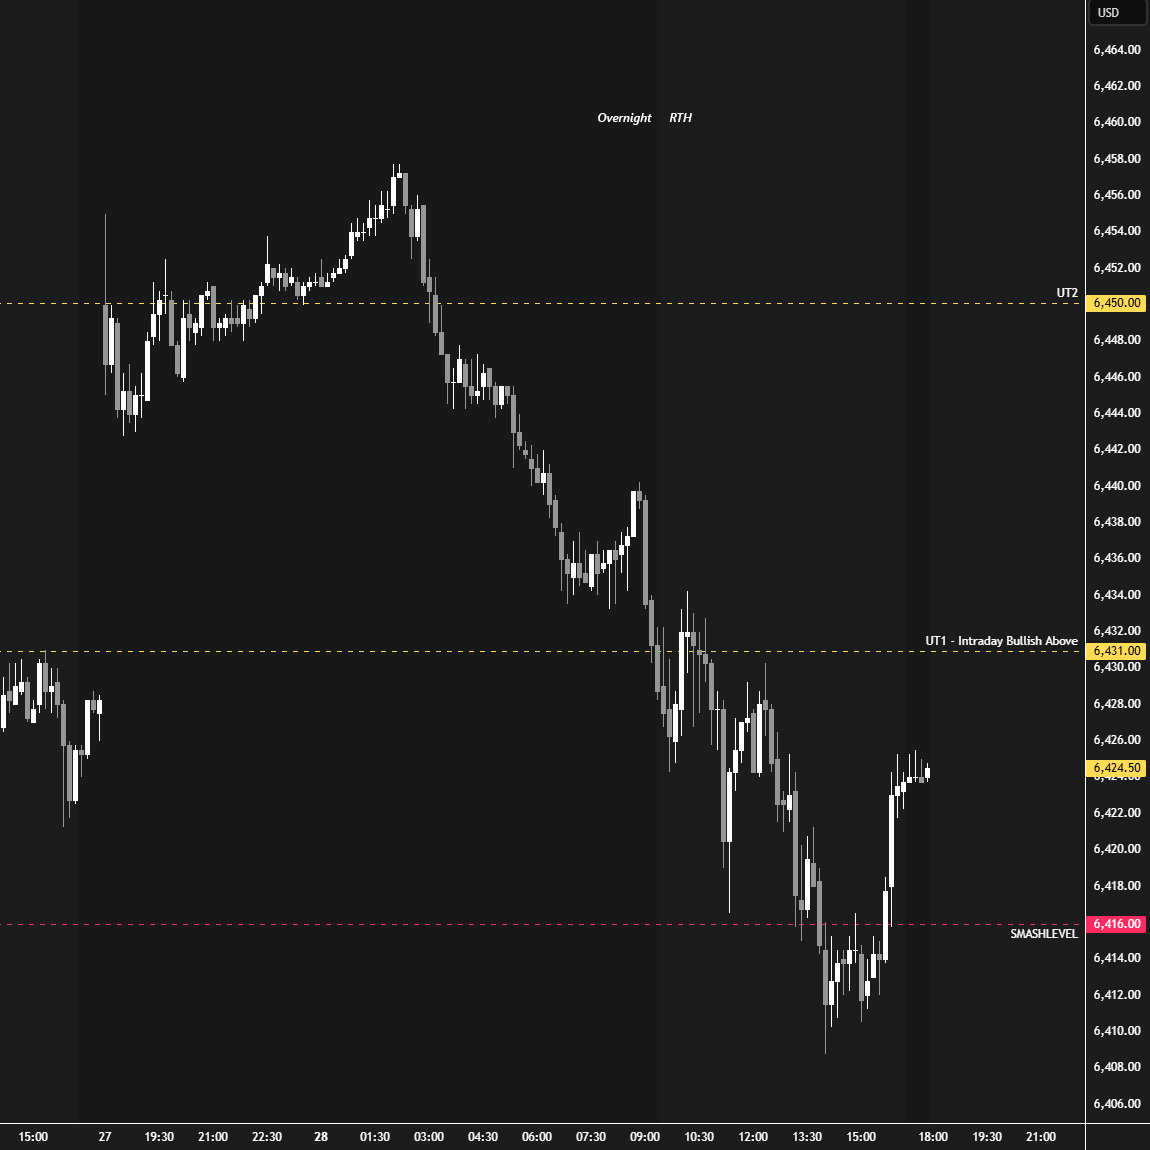
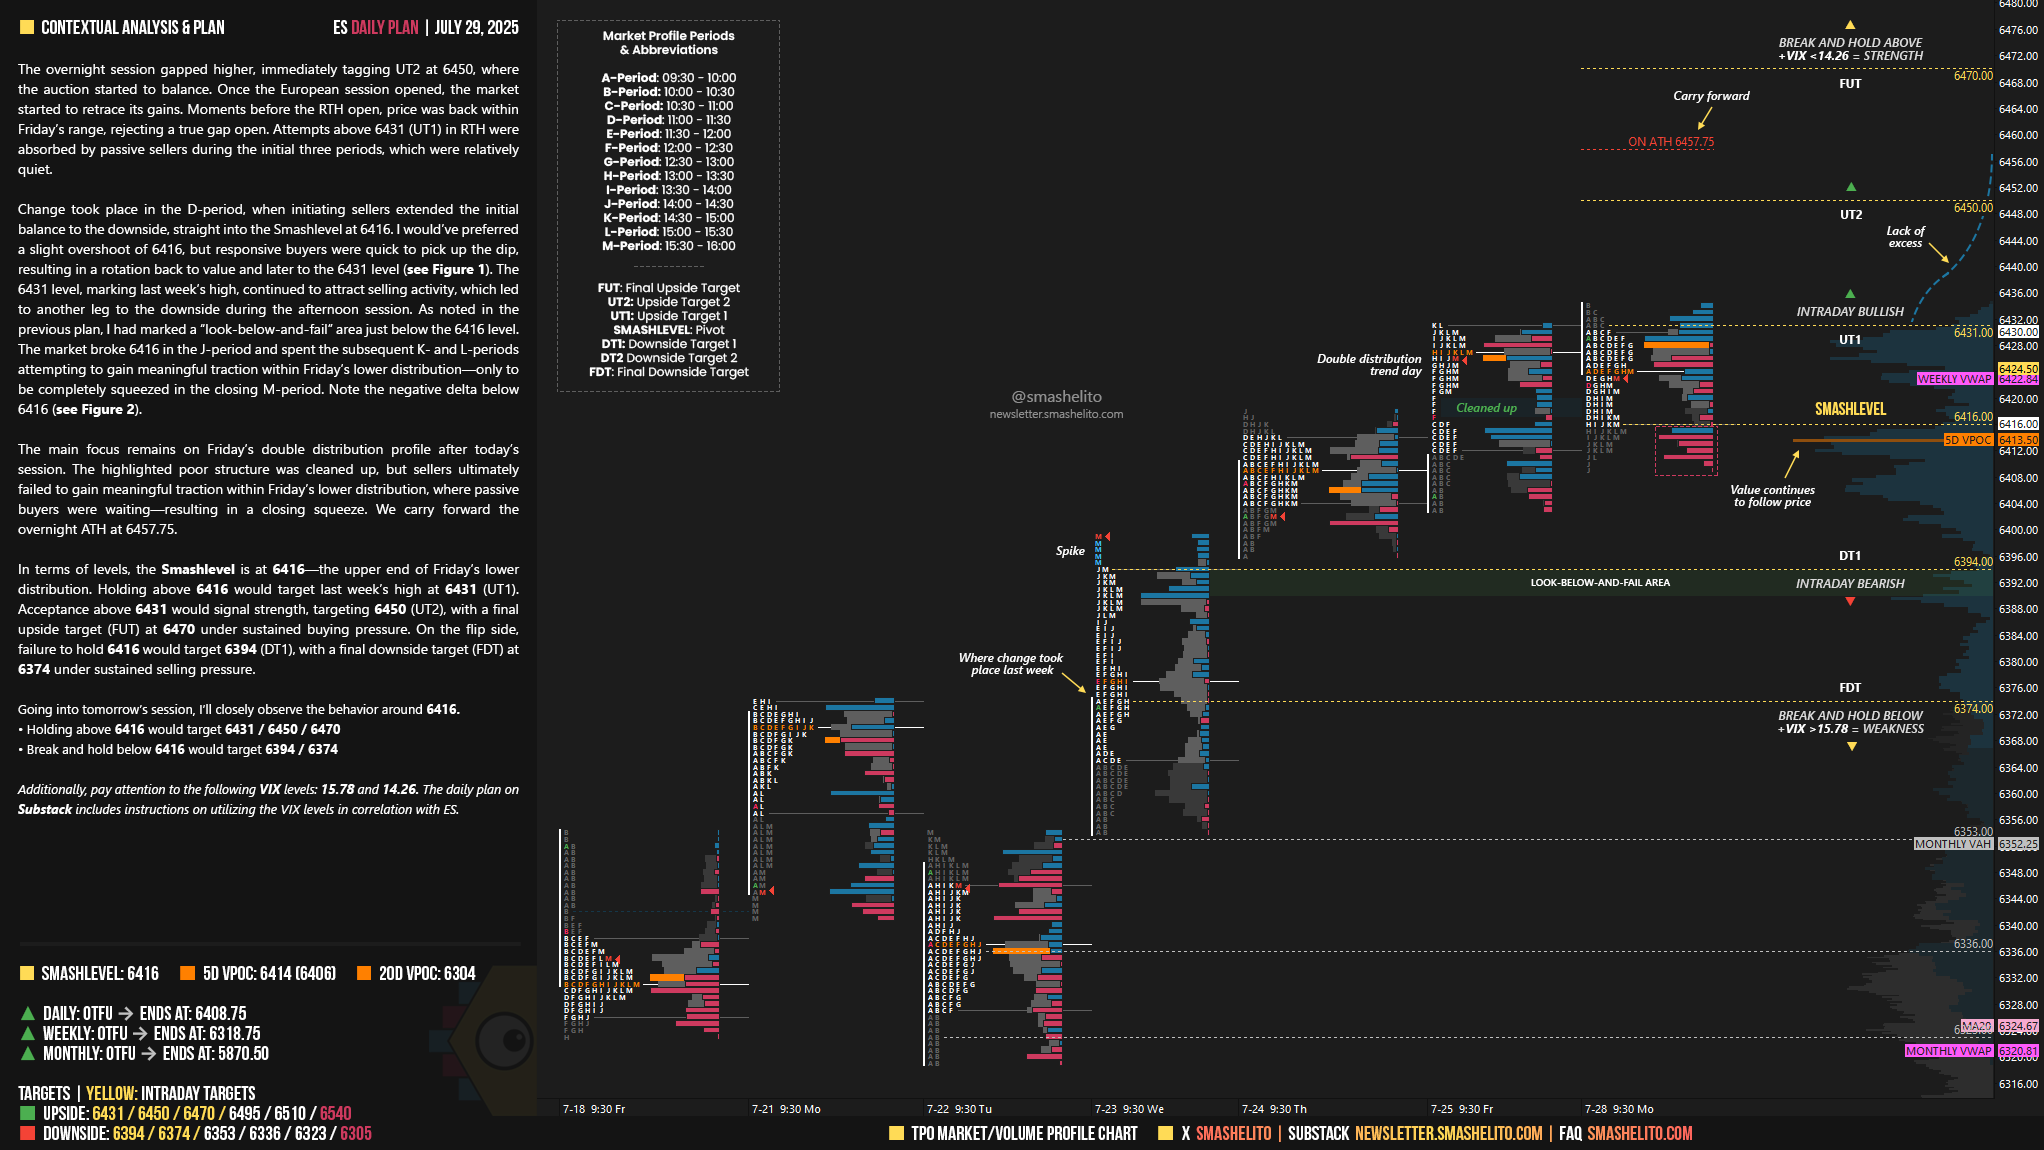
The overnight session gapped higher, immediately tagging UT2 at 6450, where the auction started to balance. Once the European session opened, the market started to retrace its gains. Moments before the RTH open, price was back within Friday’s range, rejecting a true gap open. Attempts above 6431 (UT1) in RTH were absorbed by passive sellers during the initial three periods, which were relatively quiet.
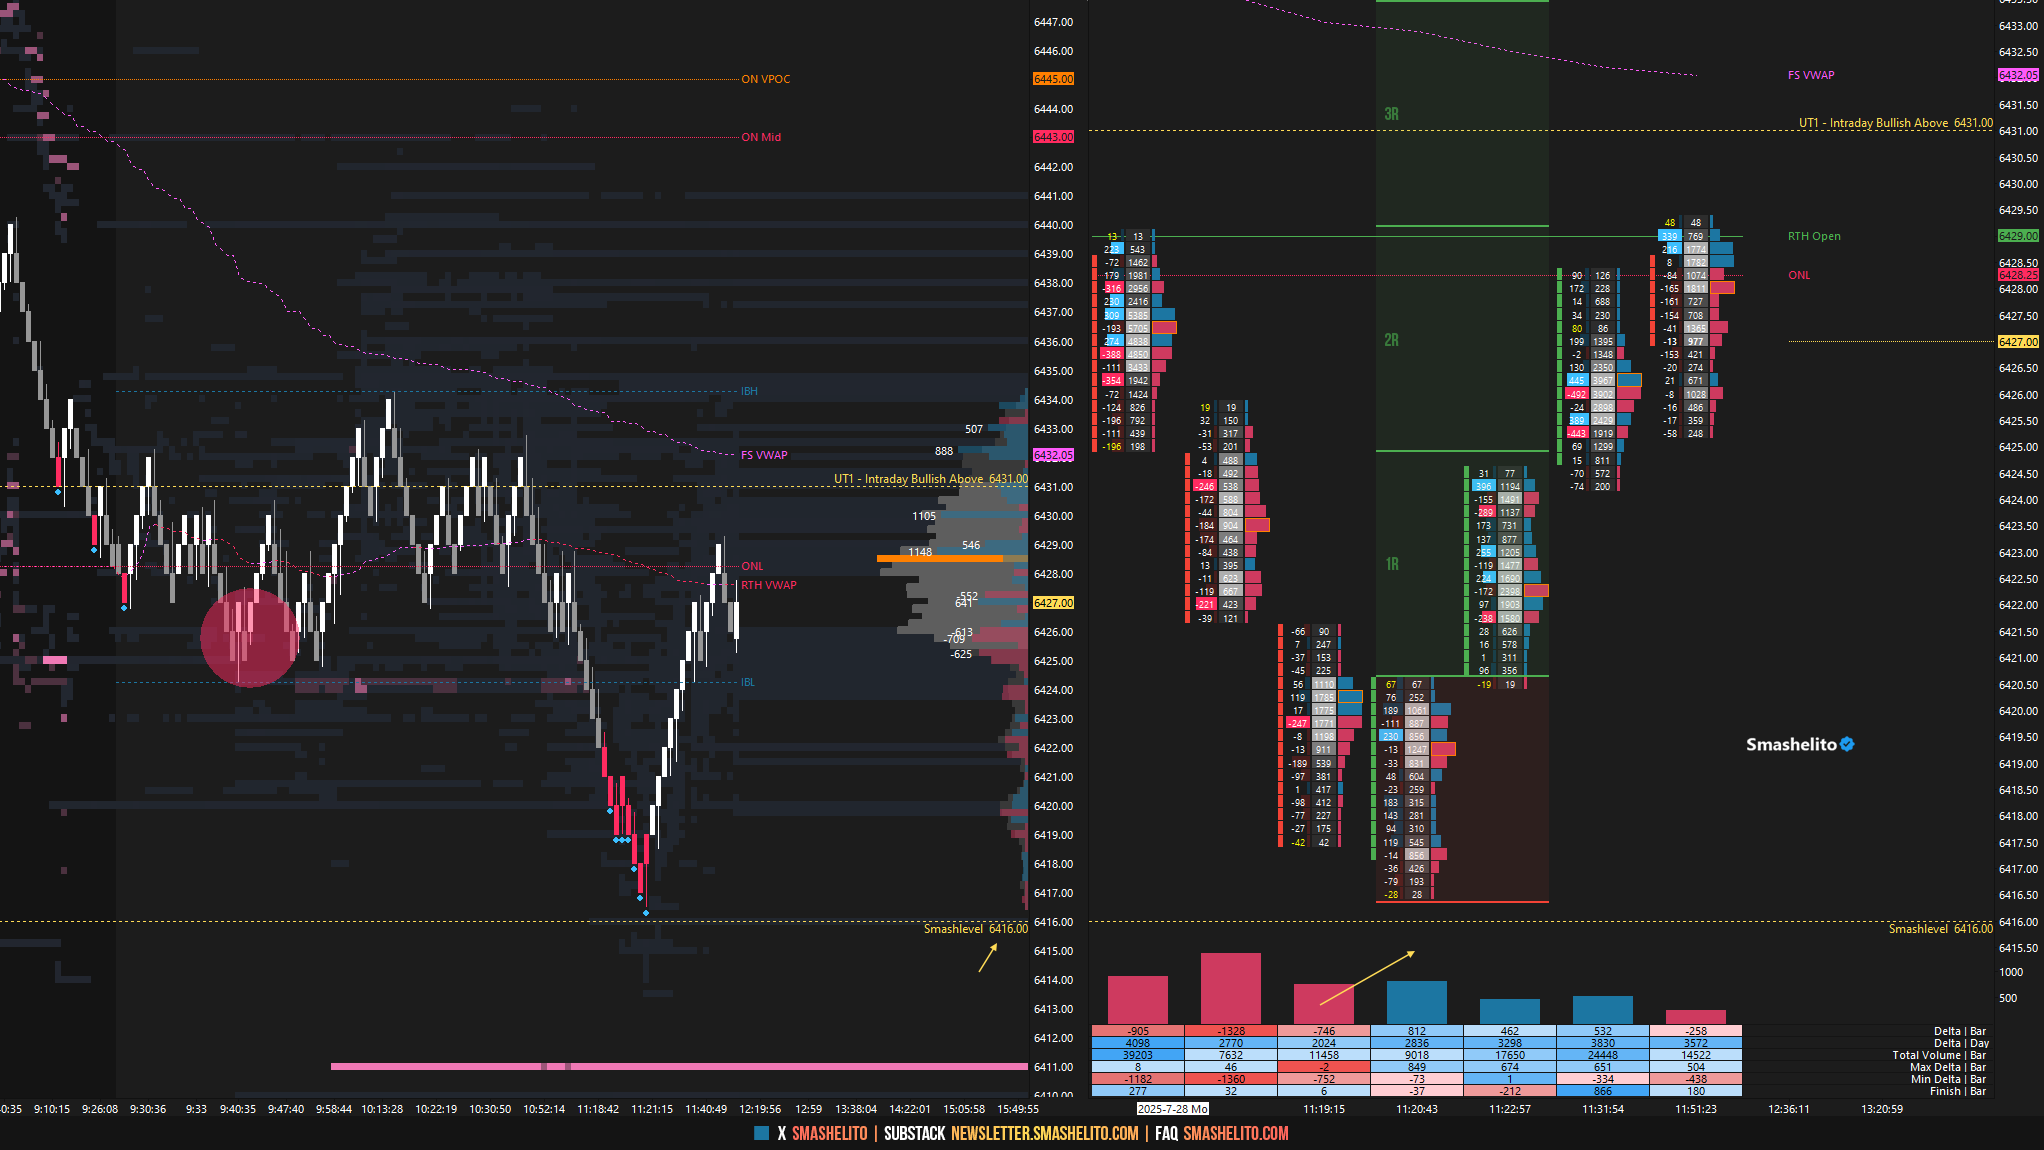
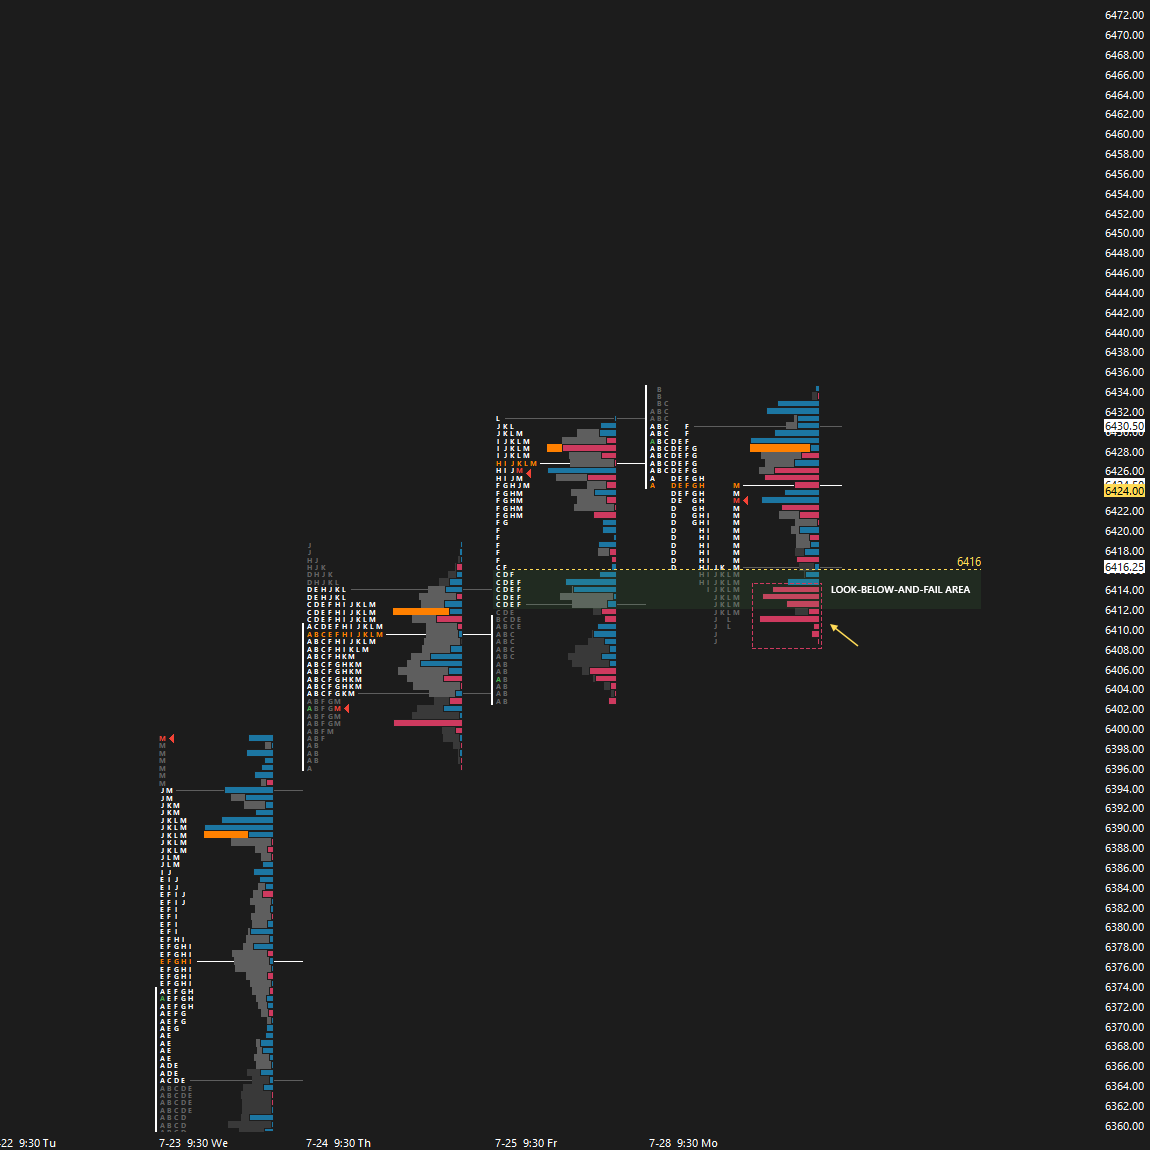
Change took place in the D-period, when initiating sellers extended the initial balance to the downside, straight into the Smashlevel at 6416. I would’ve preferred a slight overshoot of 6416, but responsive buyers were quick to pick up the dip, resulting in a rotation back to value and later to the 6431 level (see Figure 1). The 6431 level, marking last week’s high, continued to attract selling activity, which led to another leg to the downside during the afternoon session. As noted in the previous plan, I had marked a “look-below-and-fail” area just below the 6416 level. The market broke 6416 in the J-period and spent the subsequent K- and L-periods attempting to gain meaningful traction within Friday’s lower distribution—only to be completely squeezed in the closing M-period. Note the negative delta below 6416 (see Figure 2).
The main focus remains on Friday’s double distribution profile after today’s session. The highlighted poor structure was cleaned up, but sellers ultimately failed to gain meaningful traction within Friday’s lower distribution, where passive buyers were waiting—resulting in a closing squeeze. We carry forward the overnight ATH at 6457.75.
In terms of levels, the Smashlevel is at 6416—the upper end of Friday’s lower distribution. Holding above 6416 would target last week’s high at 6431 (UT1). Acceptance above 6431 would signal strength, targeting 6450 (UT2), with a final upside target (FUT) at 6470 under sustained buying pressure. On the flip side, failure to hold 6416 would target 6394 (DT1), with a final downside target (FDT) at 6374 under sustained selling pressure.
Levels of Interest
Going into tomorrow’s session, I’ll closely observe the behavior around 6416.
Holding above 6416 would target 6431 / 6450 / 6470
Break and hold below 6416 would target 6394 / 6374
Additionally, pay attention to the following VIX levels: 15.78 and 14.26. These levels can provide confirmation of strength or weakness.
Break and hold above 6470 with VIX below 14.26 would confirm strength.
Break and hold below 6374 with VIX above 15.78 would confirm weakness.
Overall, it's important to exercise caution when trading outside of the highlighted yellow levels. A non-cooperative VIX may suggest possible reversals i.e trade setups.
Thanks!
Thank you!