
ES Daily Plan | July 25, 2025
Market Context & Key Levels for the Day Ahead

— For new subscribers
The yellow levels highlighted at the bottom left of the chart are the primary intraday levels I focus on. To avoid impulsive decisions at poor trade locations, I follow a simple but effective rule: exercise caution when initiating trades outside of these yellow levels.
This means I’m cautious about chasing longs above the Final Upside Target (FUT) and shorts below the Final Downside Target (FDT). It’s important to understand that not chasing does not imply initiating a trade in the opposite direction — discipline over impulse.
Be sure to review the ES Weekly Plan | July 21-25, 2025 for a broader perspective, key levels, and market expectations for the week ahead.
Contextual Analysis & Plan
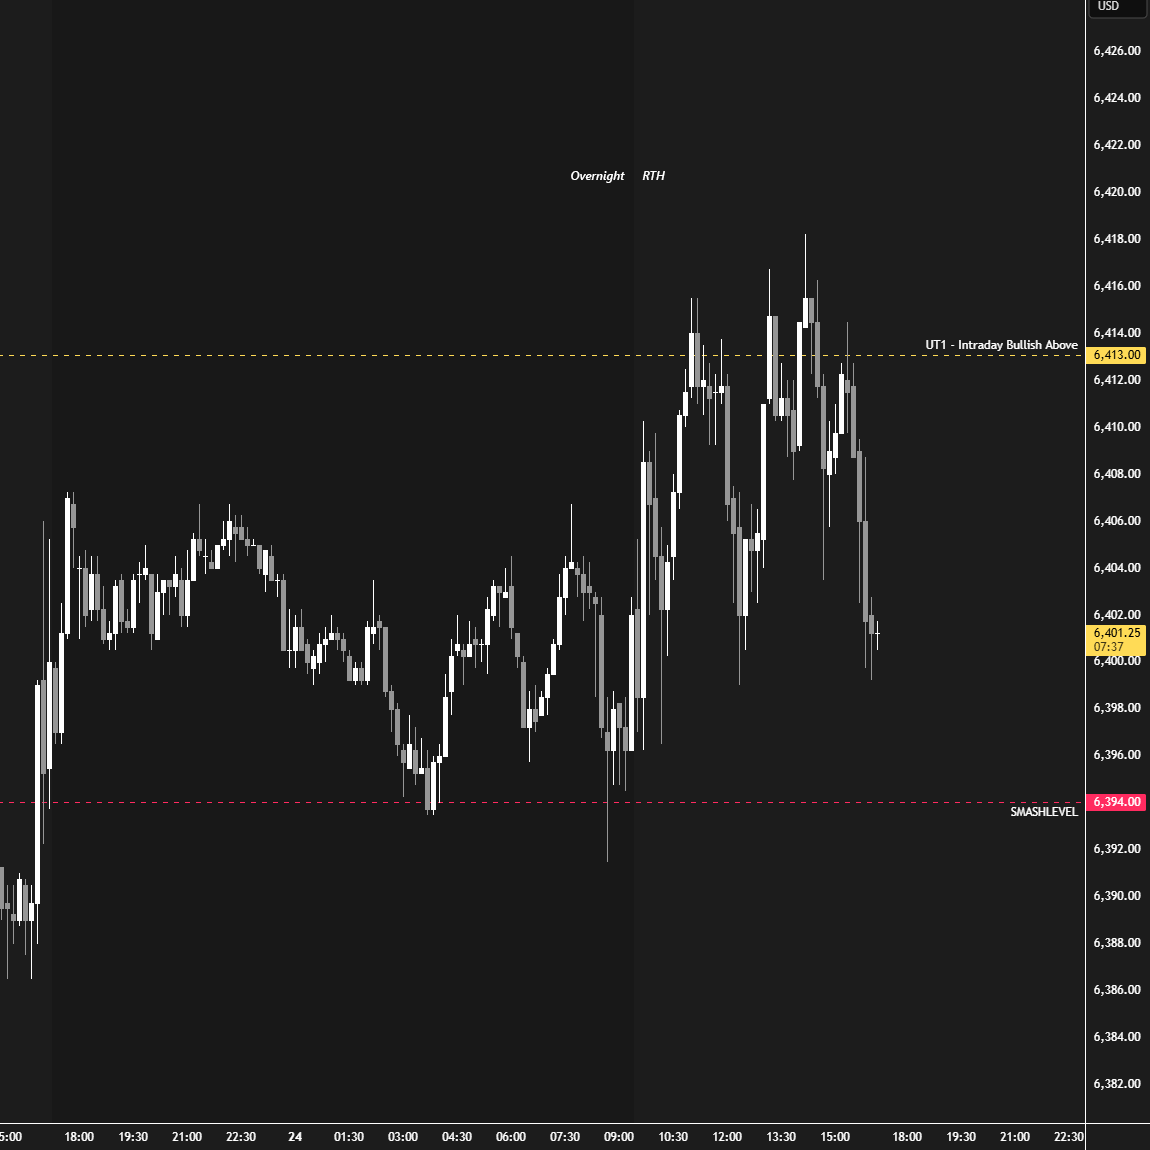
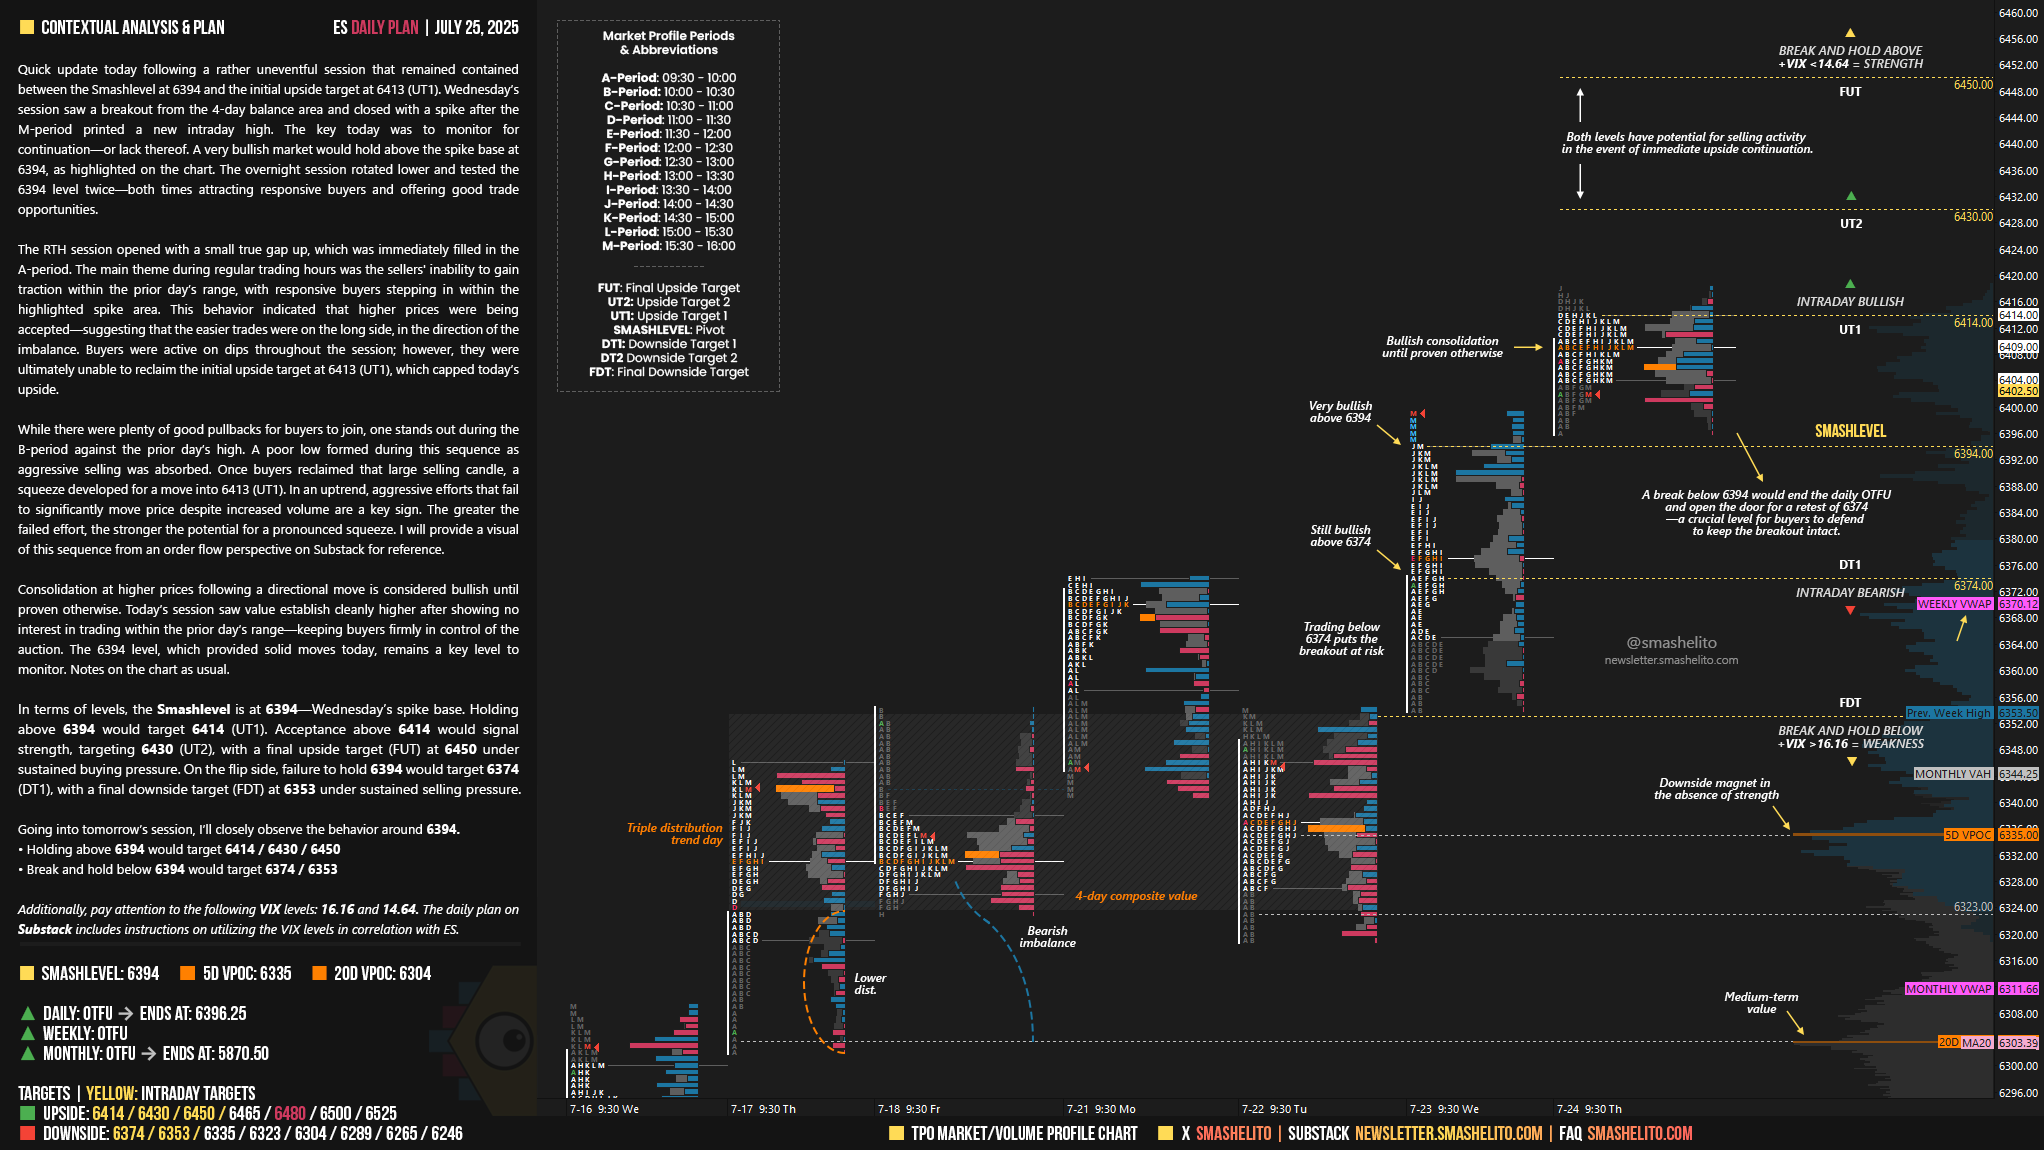
Quick update today following a rather uneventful session that remained contained between the Smashlevel at 6394 and the initial upside target at 6413 (UT1). Wednesday’s session saw a breakout from the 4-day balance area and closed with a spike after the M-period printed a new intraday high. The key today was to monitor for continuation—or lack thereof. A very bullish market would hold above the spike base at 6394, as highlighted on the chart. The overnight session rotated lower and tested the 6394 level twice—both times attracting responsive buyers and offering good trade opportunities.
The RTH session opened with a small true gap up, which was immediately filled in the A-period. The main theme during regular trading hours was the sellers' inability to gain traction within the prior day’s range, with responsive buyers stepping in within the highlighted spike area. This behavior indicated that higher prices were being accepted—suggesting that the easier trades were on the long side, in the direction of the imbalance. Buyers were active on dips throughout the session; however, they were ultimately unable to reclaim the initial upside target at 6413 (UT1), which capped today’s upside.
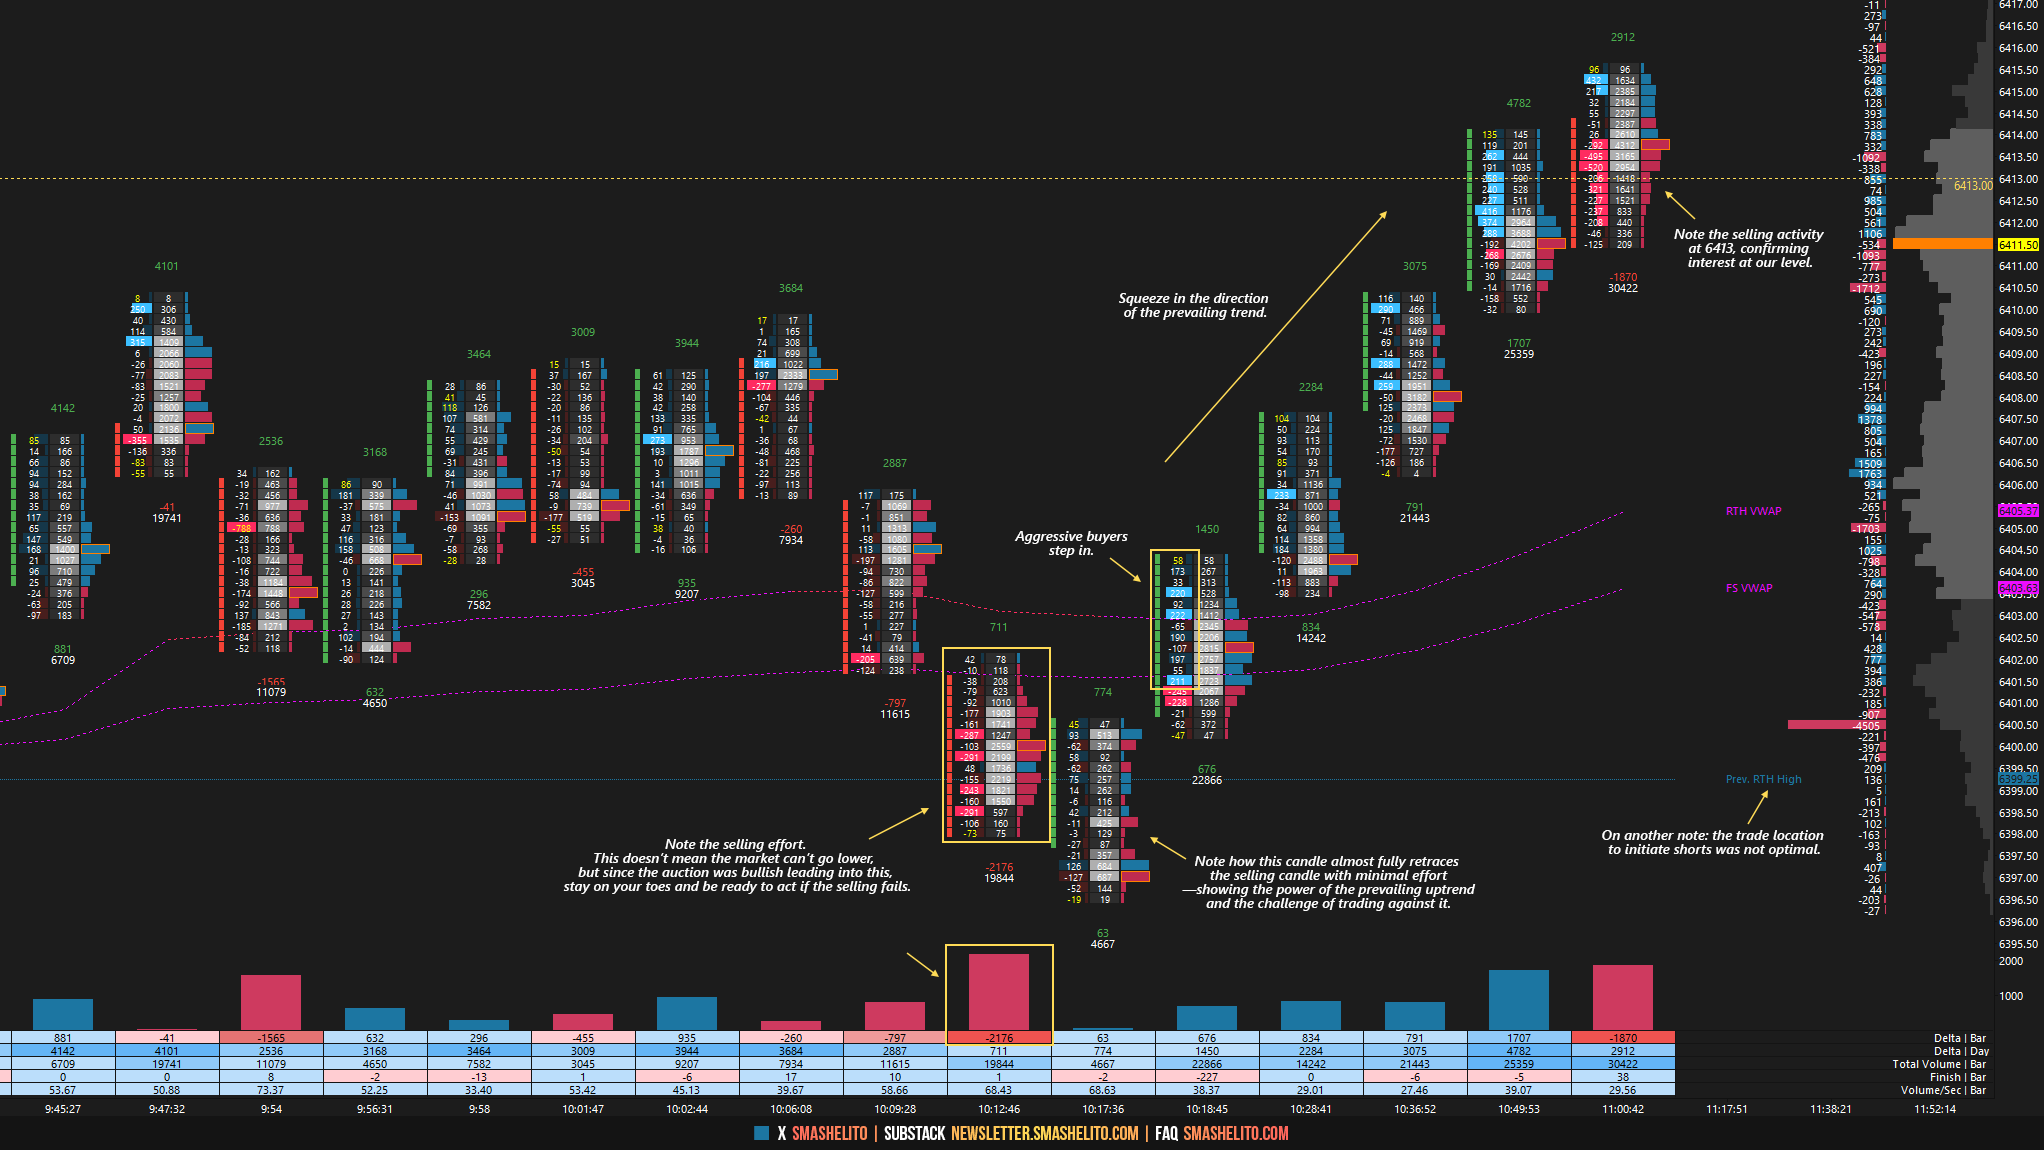
While there were plenty of good pullbacks for buyers to join, one stands out during the B-period against the prior day’s high. A poor low formed during this sequence as aggressive selling was absorbed. Once buyers reclaimed that large selling candle, a squeeze developed for a move into 6413 (UT1). In an uptrend, aggressive efforts that fail to significantly move price despite increased volume are a key sign. The greater the failed effort, the stronger the potential for a pronounced squeeze. I will provide a visual of this sequence from an order flow perspective on Substack for reference (see Figure 1).
Consolidation at higher prices following a directional move is considered bullish until proven otherwise. Today’s session saw value establish cleanly higher after showing no interest in trading within the prior day’s range—keeping buyers firmly in control of the auction. The 6394 level, which provided solid moves today, remains a key level to monitor. Notes on the chart as usual.
In terms of levels, the Smashlevel is at 6394—Wednesday’s spike base. Holding above 6394 would target 6414 (UT1). Acceptance above 6414 would signal strength, targeting 6430 (UT2), with a final upside target (FUT) at 6450 under sustained buying pressure.
On the flip side, failure to hold 6394 would target 6374 (DT1), with a final downside target (FDT) at 6353 under sustained selling pressure.
Levels of Interest
Going into tomorrow’s session, I’ll closely observe the behavior around 6394.
Holding above 6394 would target 6414 / 6430 / 6450
Break and hold below 6394 would target 6374 / 6353
Additionally, pay attention to the following VIX levels: 16.16 and 14.64. These levels can provide confirmation of strength or weakness.
Break and hold above 6450 with VIX below 14.64 would confirm strength.
Break and hold below 6353 with VIX above 16.16 would confirm weakness.
Overall, it's important to exercise caution when trading outside of the highlighted yellow levels. A non-cooperative VIX may suggest possible reversals i.e trade setups.
Thank you Smash
Love this Smash, thank you!