
ES Daily Plan | July 24, 2025
Market Context & Key Levels for the Day Ahead

— For new subscribers
The yellow levels highlighted at the bottom left of the chart are the primary intraday levels I focus on. To avoid impulsive decisions at poor trade locations, I follow a simple but effective rule: exercise caution when initiating trades outside of these yellow levels.
This means I’m cautious about chasing longs above the Final Upside Target (FUT) and shorts below the Final Downside Target (FDT). It’s important to understand that not chasing does not imply initiating a trade in the opposite direction — discipline over impulse.
Be sure to review the ES Weekly Plan | July 21-25, 2025 for a broader perspective, key levels, and market expectations for the week ahead.
Contextual Analysis & Plan
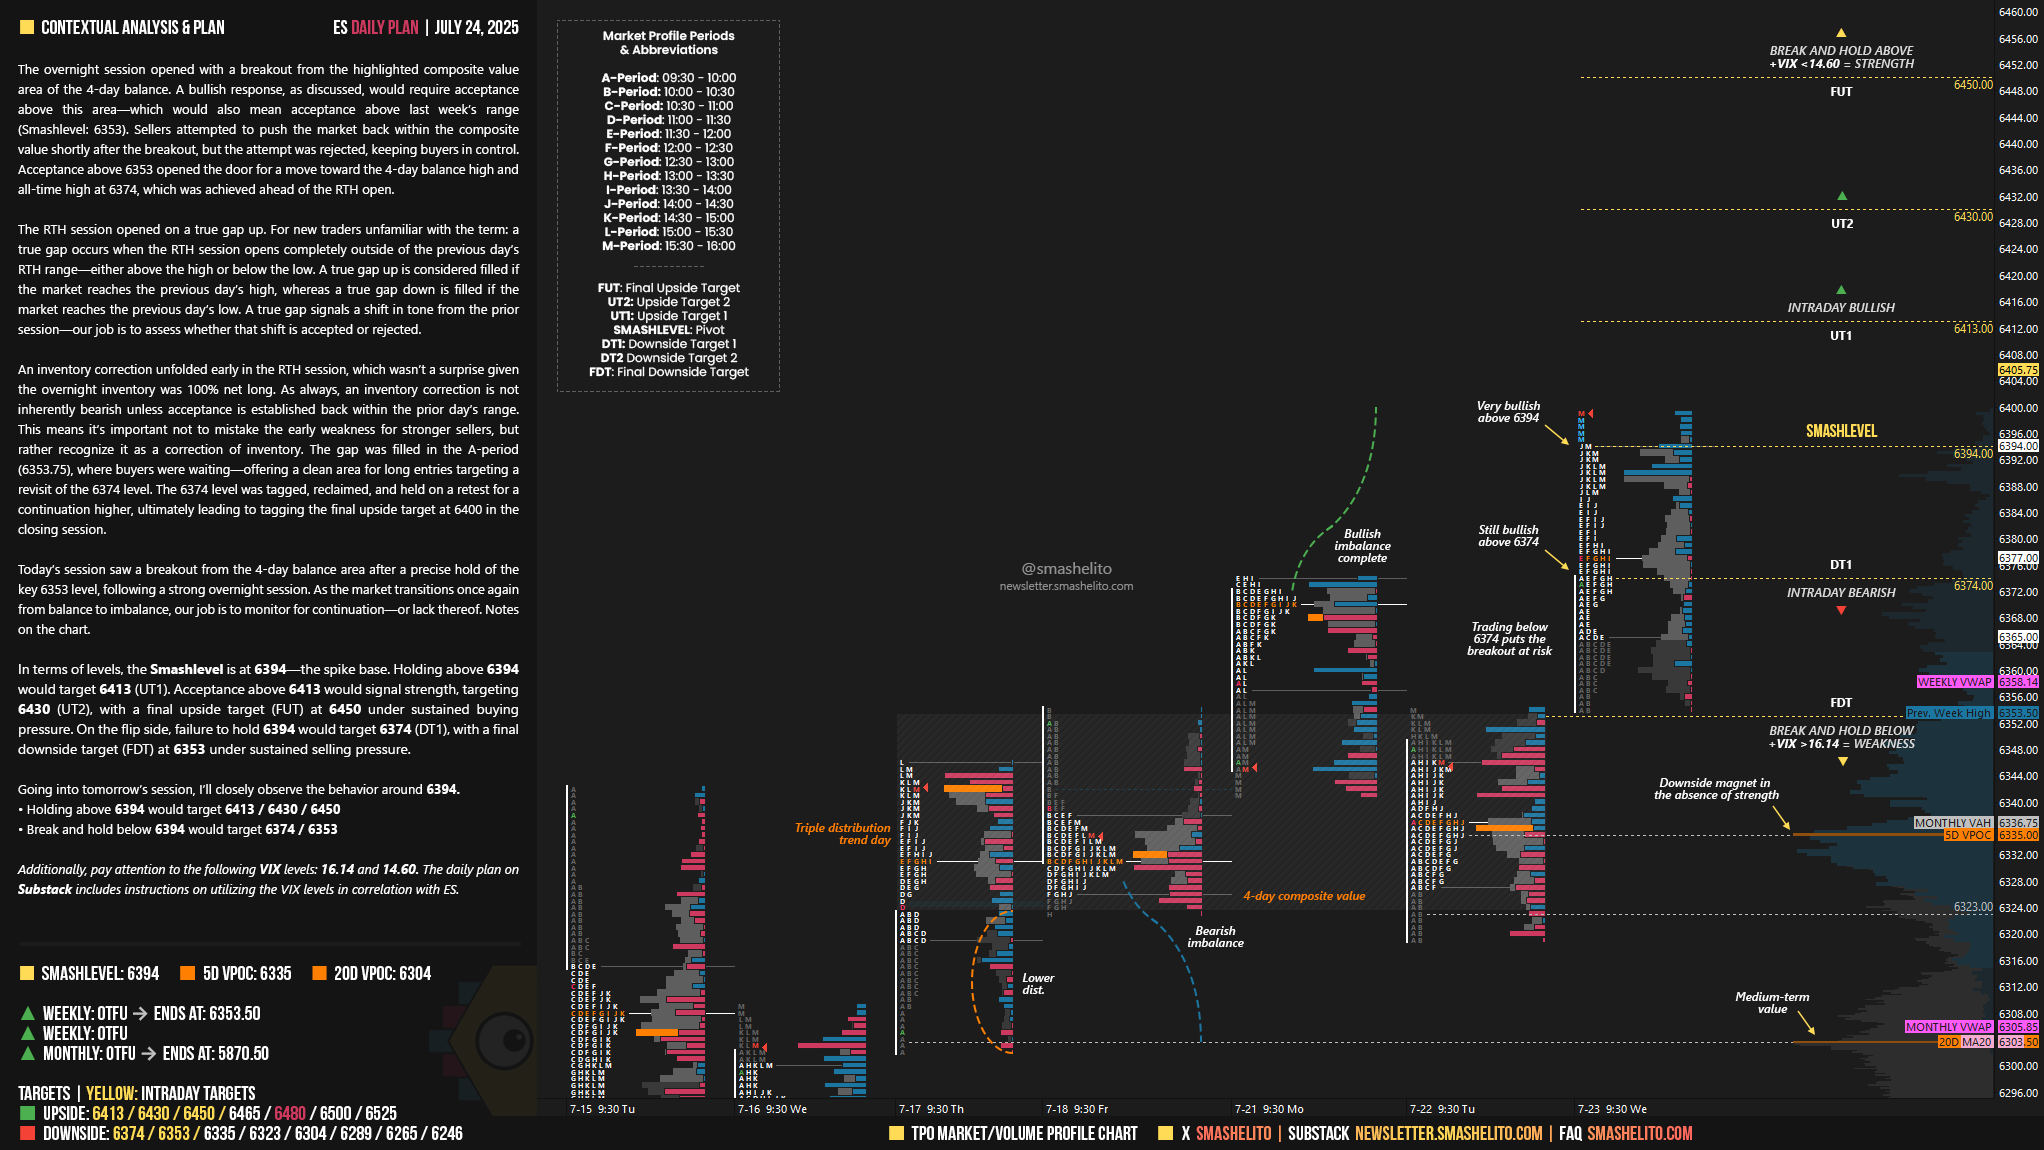
The overnight session opened with a breakout from the highlighted composite value area of the 4-day balance. A bullish response, as discussed, would require acceptance above this area—which would also mean acceptance above last week’s range (Smashlevel: 6353). Sellers attempted to push the market back within the composite value shortly after the breakout, but the attempt was rejected, keeping buyers in control. Acceptance above 6353 opened the door for a move toward the 4-day balance high and all-time high at 6374, which was achieved ahead of the RTH open.
The RTH session opened on a true gap up. For new traders unfamiliar with the term: a true gap occurs when the RTH session opens completely outside of the previous day’s RTH range—either above the high or below the low. A true gap up is considered filled if the market reaches the previous day’s high, whereas a true gap down is filled if the market reaches the previous day’s low. A true gap signals a shift in tone from the prior session—our job is to assess whether that shift is accepted or rejected.
An inventory correction unfolded early in the RTH session, which wasn’t a surprise given the overnight inventory was 100% net long. As always, an inventory correction is not inherently bearish unless acceptance is established back within the prior day’s range. This means it’s important not to mistake the early weakness for stronger sellers, but rather recognize it as a correction of inventory. The gap was filled in the A-period (6353.75), where buyers were waiting—offering a clean area for long entries targeting a revisit of the 6374 level. The 6374 level was tagged, reclaimed, and held on a retest for a continuation higher, ultimately leading to tagging the final upside target at 6400 in the closing session.
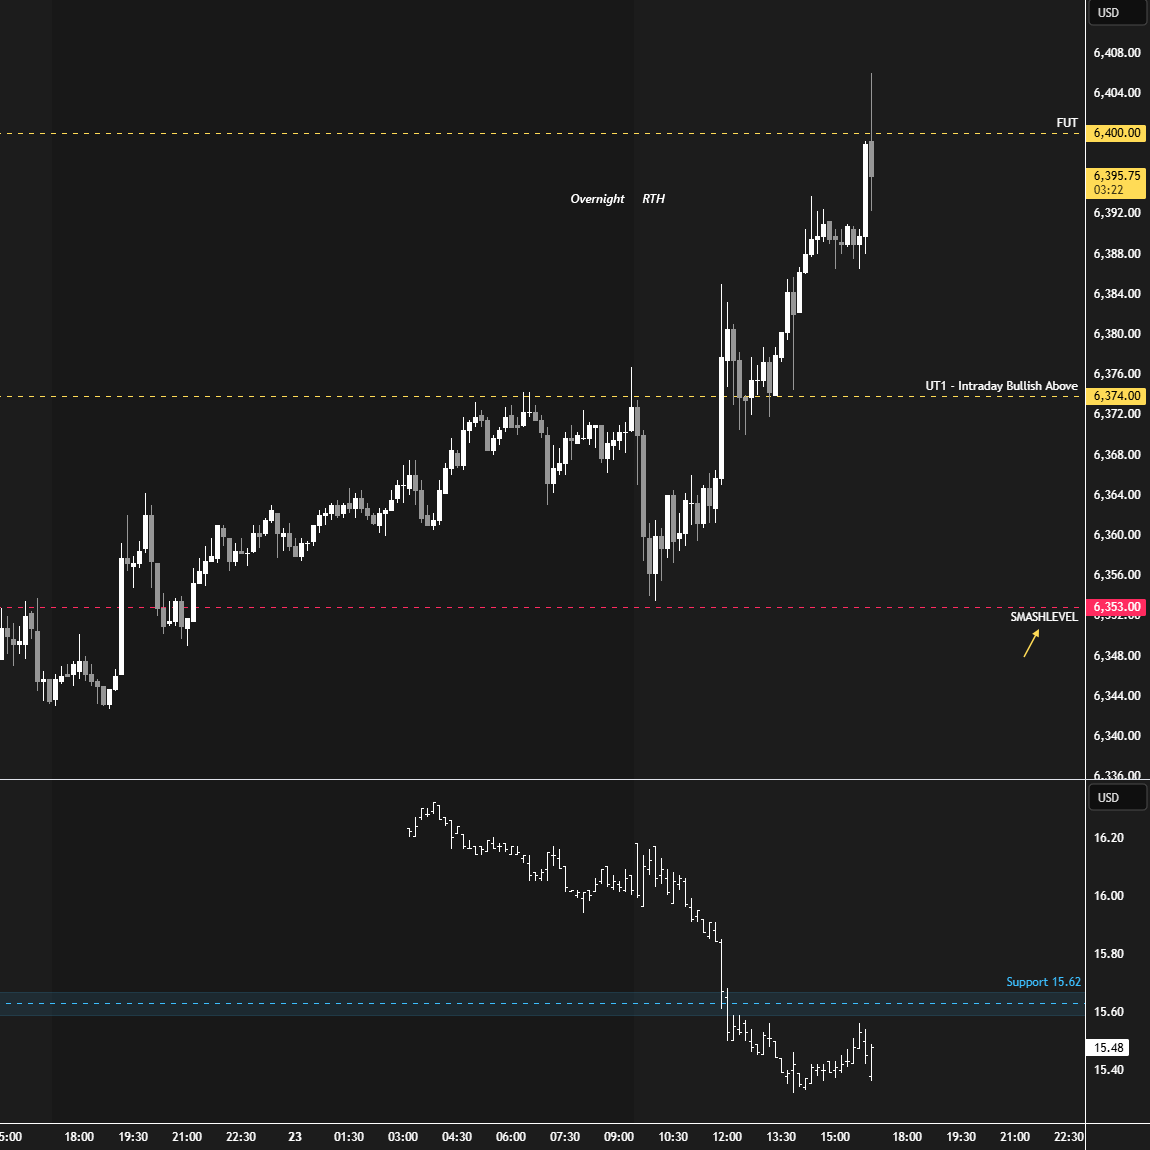
Today’s session saw a breakout from the 4-day balance area after a precise hold of the key 6353 level, following a strong overnight session. As the market transitions once again from balance to imbalance, our job is to monitor for continuation—or lack thereof. Notes on the chart.
In terms of levels, the Smashlevel is at 6394—the spike base. Holding above 6394 would target 6413 (UT1). Acceptance above 6413 would signal strength, targeting 6430 (UT2), with a final upside target (FUT) at 6450 under sustained buying pressure.
On the flip side, failure to hold 6394 would target 6374 (DT1), with a final downside target (FDT) at 6353 under sustained selling pressure.
Levels of Interest
Going into tomorrow’s session, I’ll closely observe the behavior around 6394.
Holding above 6394 would target 6413 / 6430 / 6450
Break and hold below 6394 would target 6374 / 6353
Additionally, pay attention to the following VIX levels: 16.14 and 14.60. These levels can provide confirmation of strength or weakness.
Break and hold above 6450 with VIX below 14.60 would confirm strength.
Break and hold below 6353 with VIX above 16.14 would confirm weakness.
Overall, it's important to exercise caution when trading outside of the highlighted yellow levels. A non-cooperative VIX may suggest possible reversals i.e trade setups.
Hi Smah., what exactly do you mean, when you say spike base, is that price at which m period started?
p.s. ...with final dowside target at 6289, you probably meant 6353 as marked on the chart.
Thanks for great plan for today!
W smash