

— For new subscribers
The yellow levels highlighted at the bottom left of the chart are the primary intraday levels I focus on. To avoid impulsive decisions at poor trade locations, I follow a simple but effective rule: exercise caution when initiating trades outside of these yellow levels.
This means I’m cautious about chasing longs above the Final Upside Target (FUT) and shorts below the Final Downside Target (FDT). It’s important to understand that not chasing does not imply initiating a trade in the opposite direction. Discipline over impulse.
Be sure to review the Weekly Plan for a broader perspective, key levels, and market expectations for the week ahead.

Contextual Analysis & Plan
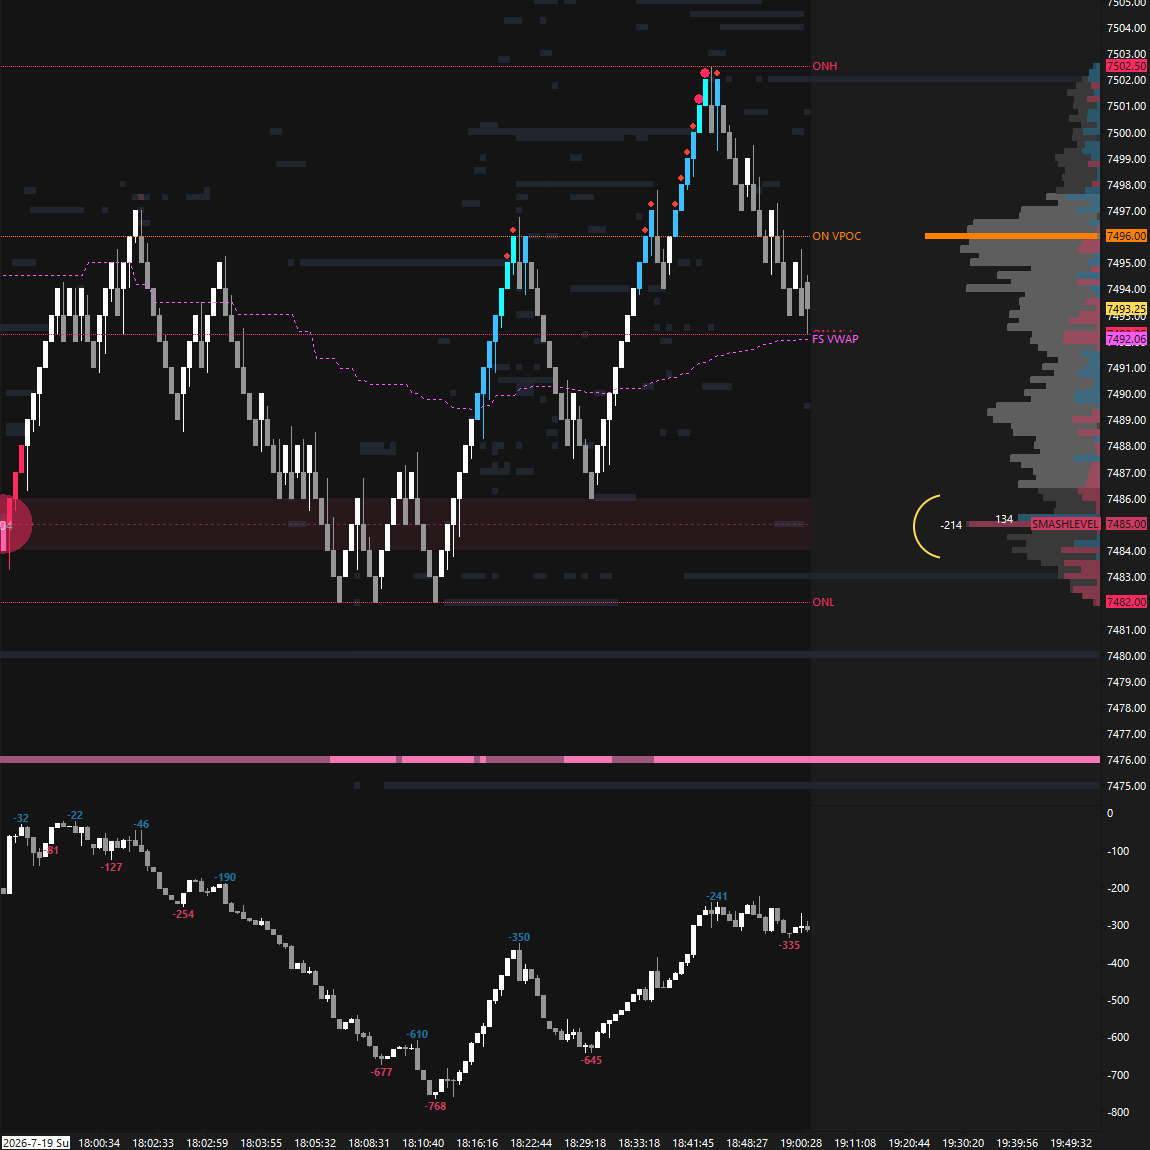
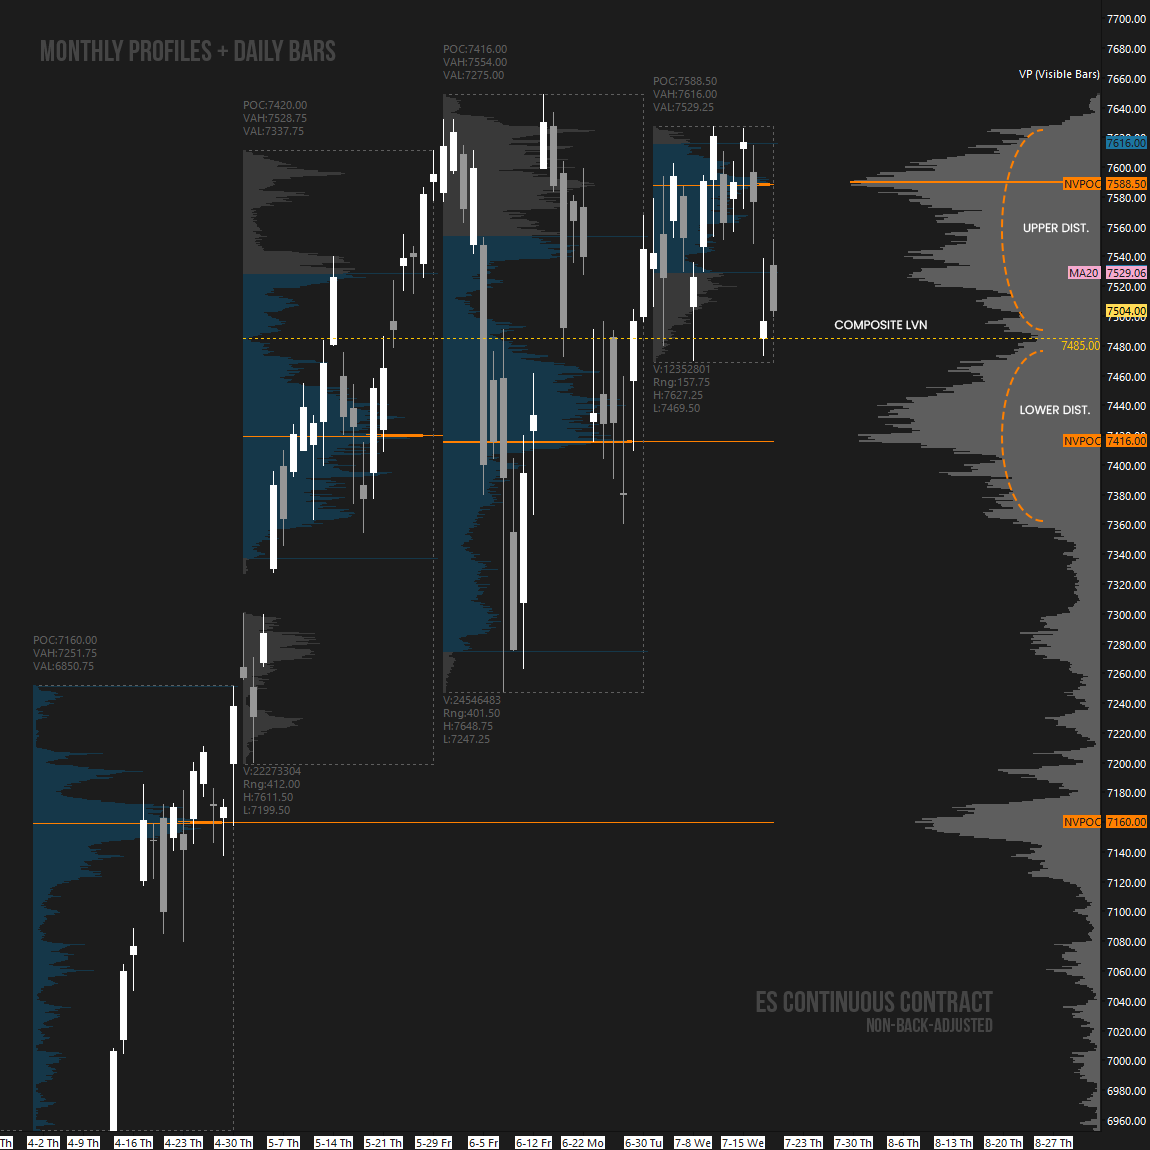
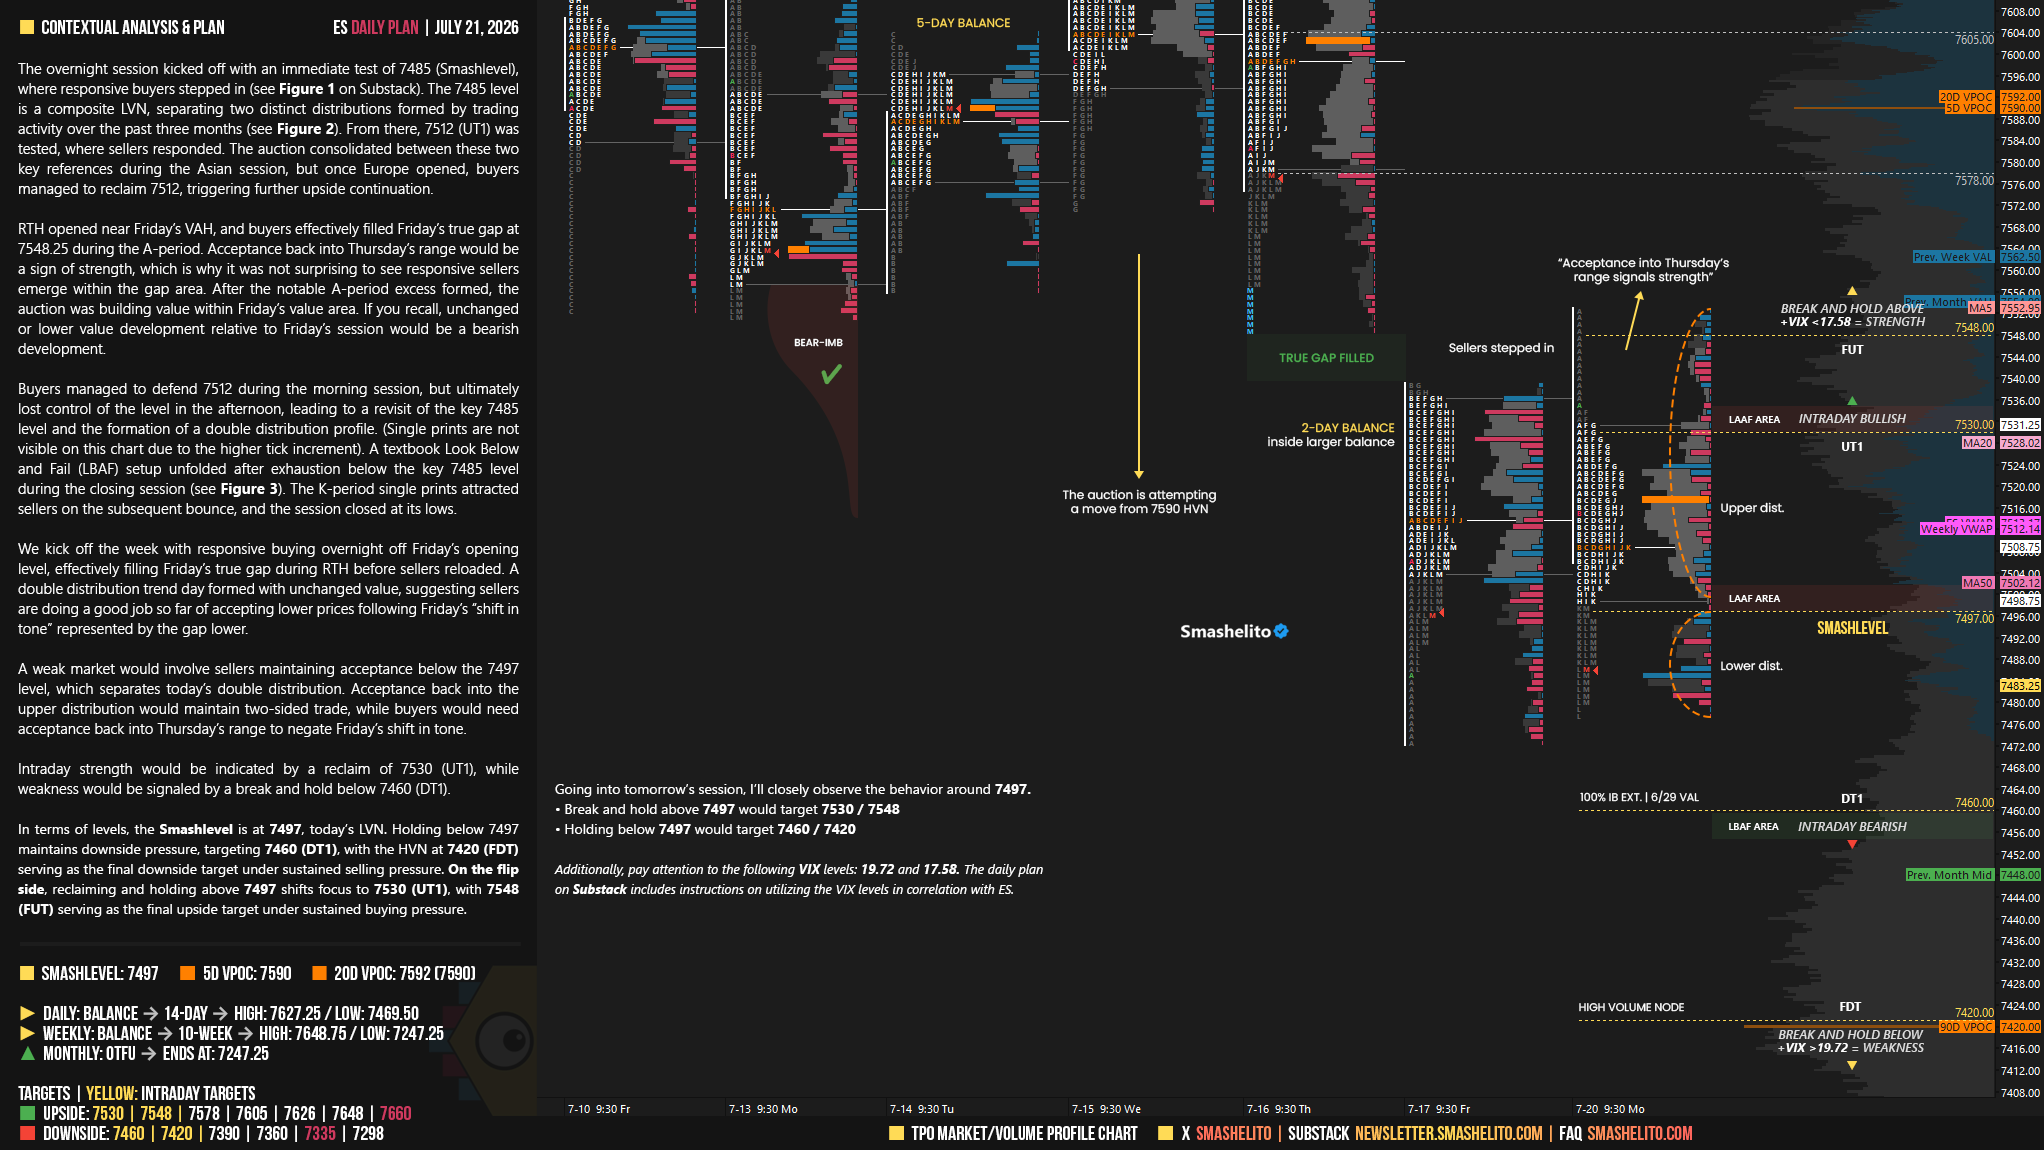
The overnight session kicked off with an immediate test of 7485 (Smashlevel), where responsive buyers stepped in (see Figure 1). The 7485 level is a composite LVN, separating two distinct distributions formed by trading activity over the past three months (see Figure 2). From there, 7512 (UT1) was tested, where sellers responded. The auction consolidated between these two key references during the Asian session, but once Europe opened, buyers managed to reclaim 7512, triggering further upside continuation.
RTH opened near Friday’s VAH, and buyers effectively filled Friday’s true gap at 7548.25 during the A-period. Acceptance back into Thursday’s range would be a sign of strength, which is why it was not surprising to see responsive sellers emerge within the gap area. After the notable A-period excess formed, the auction was building value within Friday’s value area. If you recall, unchanged or lower value development relative to Friday’s session would be a bearish development.
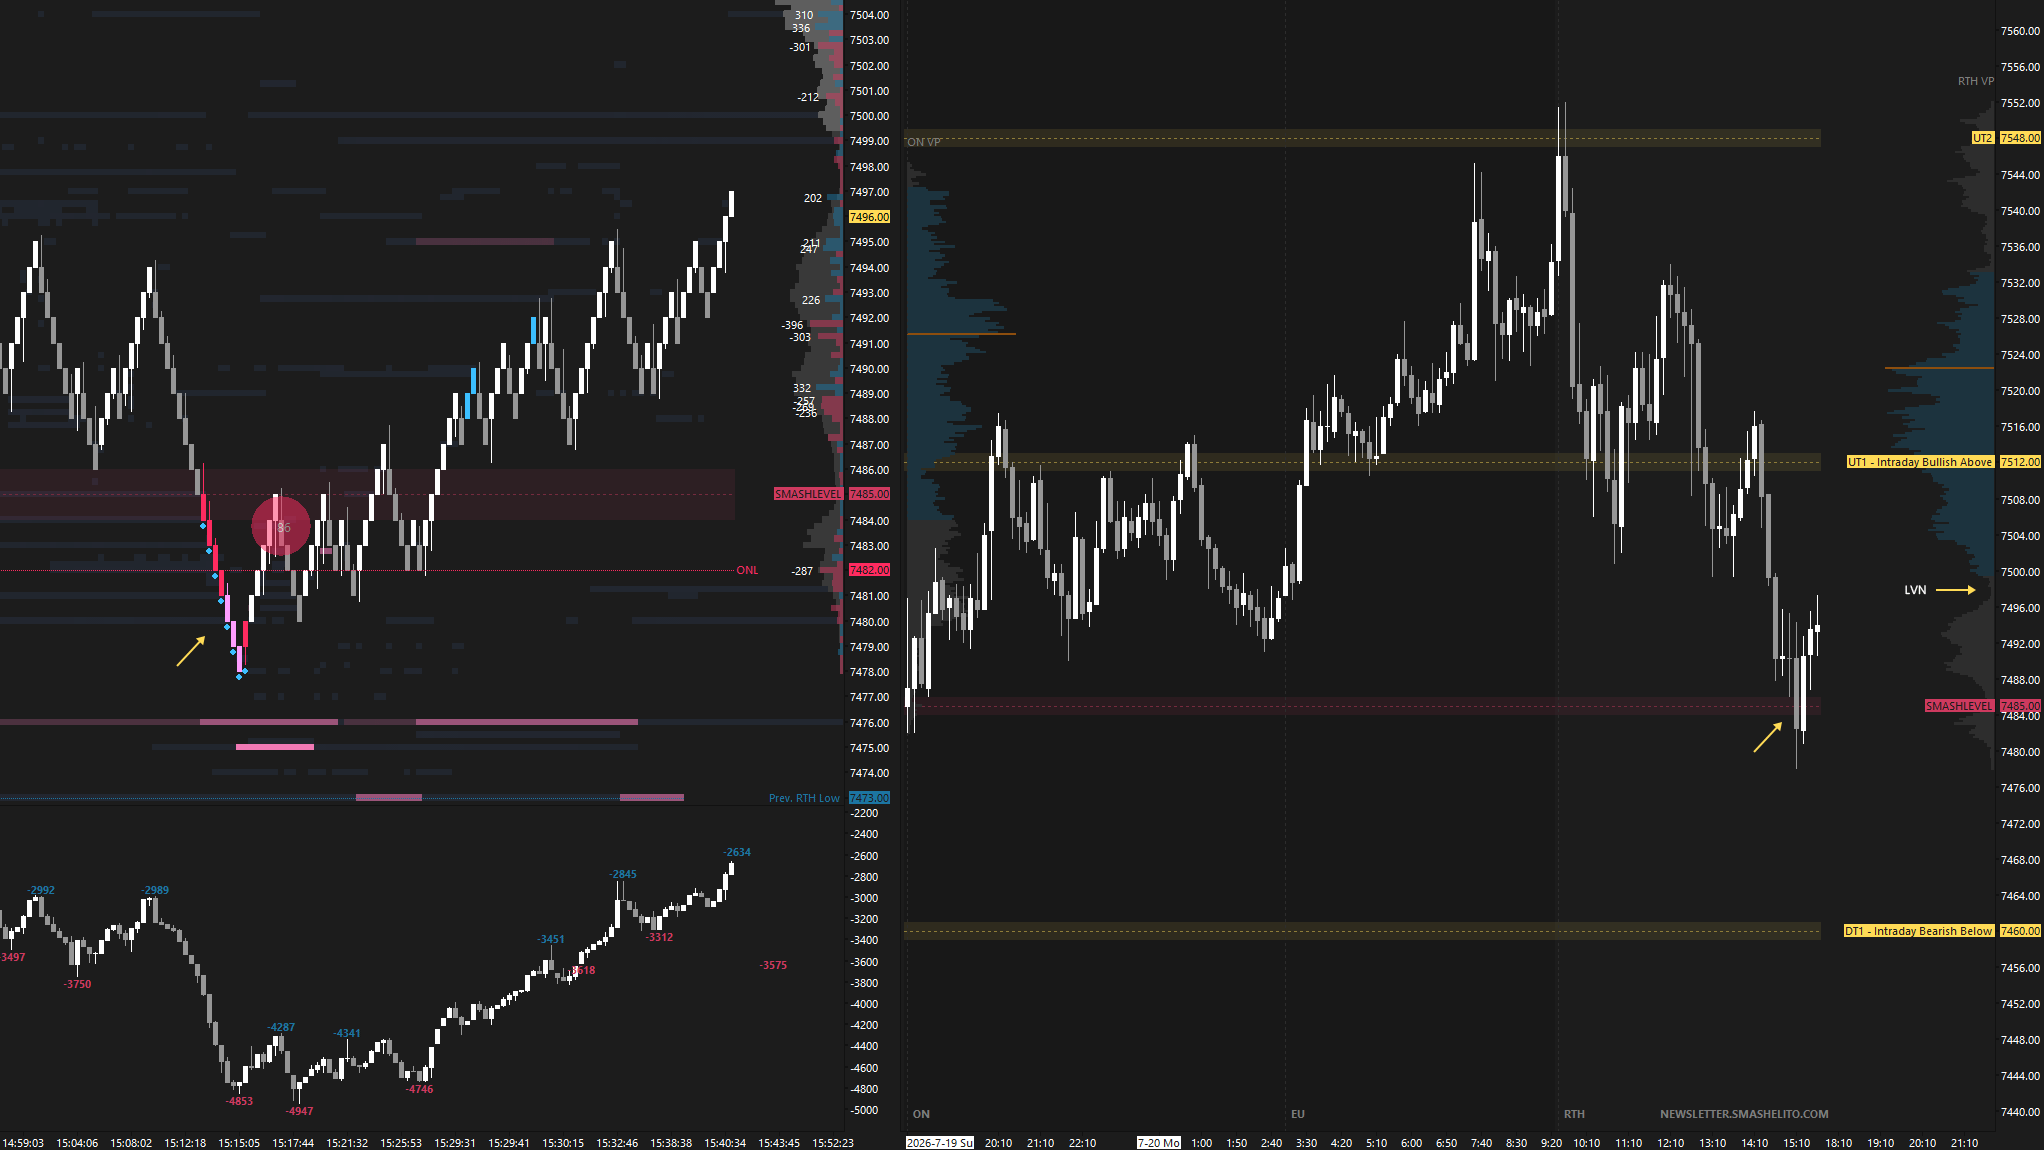
Buyers managed to defend 7512 during the morning session, but ultimately lost control of the level in the afternoon, leading to a revisit of the key 7485 level and the formation of a double distribution profile. (Single prints are not visible on this chart due to the higher tick increment). A textbook Look Below and Fail (LBAF) setup unfolded after exhaustion below the key 7485 level during the closing session (see Figure 3). The K-period single prints attracted sellers on the subsequent bounce, and the session closed at its lows.
Session Recap
Note how pivotal the VIX support level at 17.68 proved to be today.
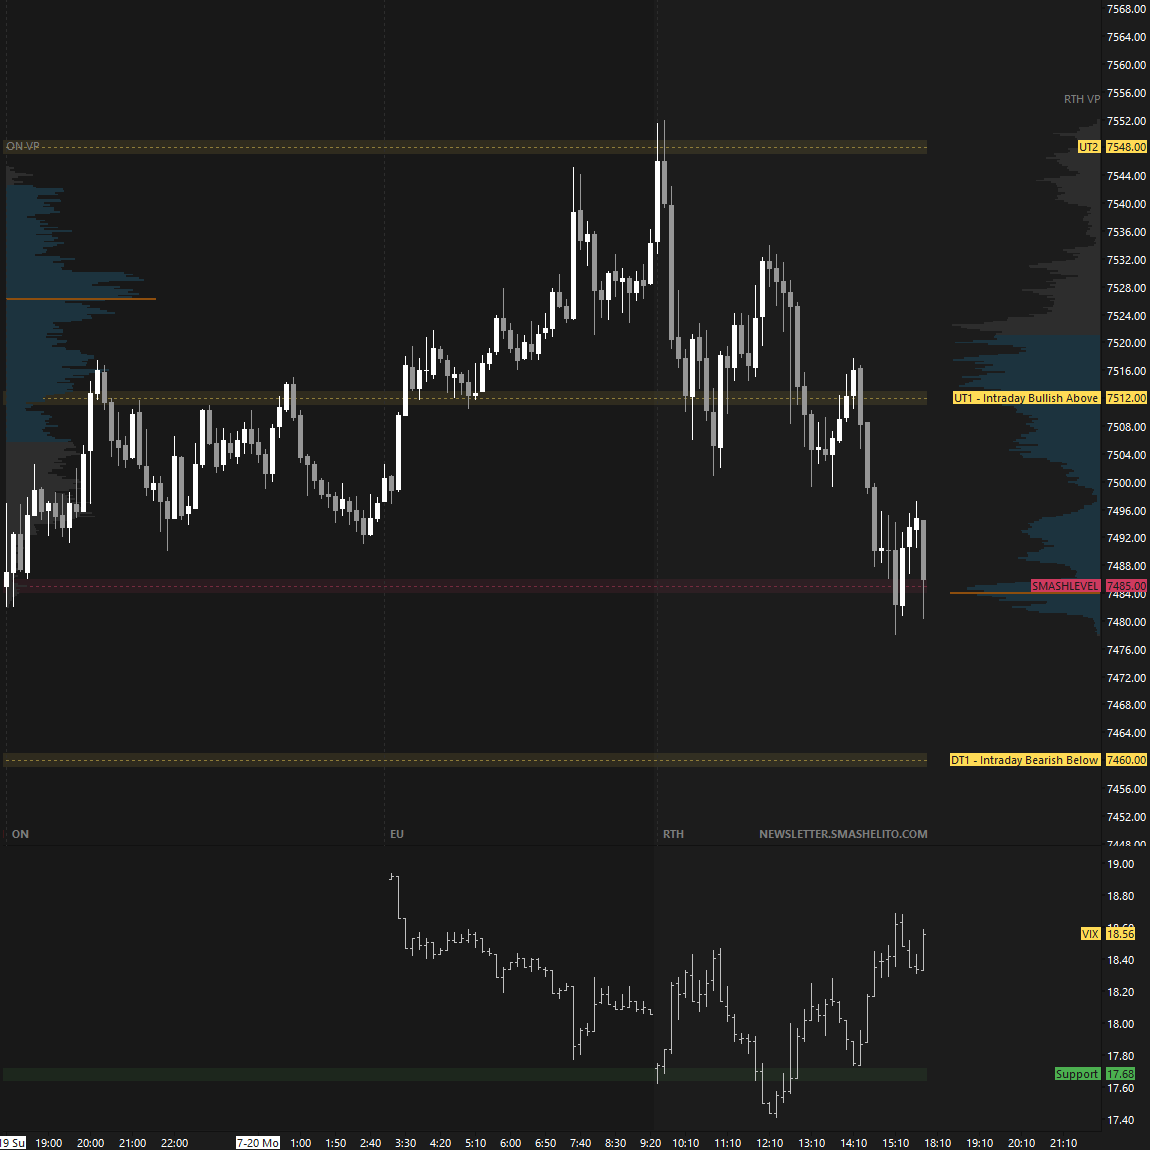
We kick off the week with responsive buying overnight off Friday’s opening level, effectively filling Friday’s true gap during RTH before sellers reloaded.
A double distribution trend day formed with unchanged value, suggesting sellers are doing a good job so far of accepting lower prices following Friday’s “shift in tone” represented by the gap lower.
A weak market would involve sellers maintaining acceptance below the 7497 level, which separates today’s double distribution.
Acceptance back into the upper distribution would maintain two-sided trade, while buyers would need acceptance back into Thursday’s range to negate Friday’s shift in tone.
Intraday strength would be indicated by a reclaim of 7530 (UT1), while weakness would be signaled by a break and hold below 7460 (DT1).
In terms of levels, the Smashlevel is at 7497, today’s LVN. Holding below 7497 maintains downside pressure, targeting 7460 (DT1), with the HVN at 7420 (FDT) serving as the final downside target under sustained selling pressure.
On the flip side, reclaiming and holding above 7497 shifts focus to 7530 (UT1), with 7548 (FUT) serving as the final upside target under sustained buying pressure.
Visual Representation
Levels of Interest
Going into tomorrow’s session, I’ll closely observe the behavior around 7497.
Break and hold above 7497 would target 7530 / 7548
Holding below 7497 would target 7460 / 7420
Additionally, pay attention to the following VIX levels: 19.72 and 17.58 These levels can provide confirmation of strength or weakness.
Break and hold above 7548 with VIX below 17.58 would confirm strength.
Break and hold below 7420 with VIX above 19.72 would confirm weakness.
Overall, it's important to exercise caution when trading outside of the highlighted yellow levels. A non-cooperative VIX may suggest possible reversals i.e trade setups.
Grateful for your analysis
Very actionable and educational
THANKS A LOT, SMASH! Very educational as always