
ES Daily Plan | July 2, 2026
Market Context & Key Levels for the Day Ahead

— For new subscribers
The yellow levels highlighted at the bottom left of the chart are the primary intraday levels I focus on. To avoid impulsive decisions at poor trade locations, I follow a simple but effective rule: exercise caution when initiating trades outside of these yellow levels.
This means I’m cautious about chasing longs above the Final Upside Target (FUT) and shorts below the Final Downside Target (FDT). It’s important to understand that not chasing does not imply initiating a trade in the opposite direction, discipline over impulse.
Be sure to review the Weekly Plan for a broader perspective, key levels, and market expectations for the week ahead.

Contextual Analysis & Plan
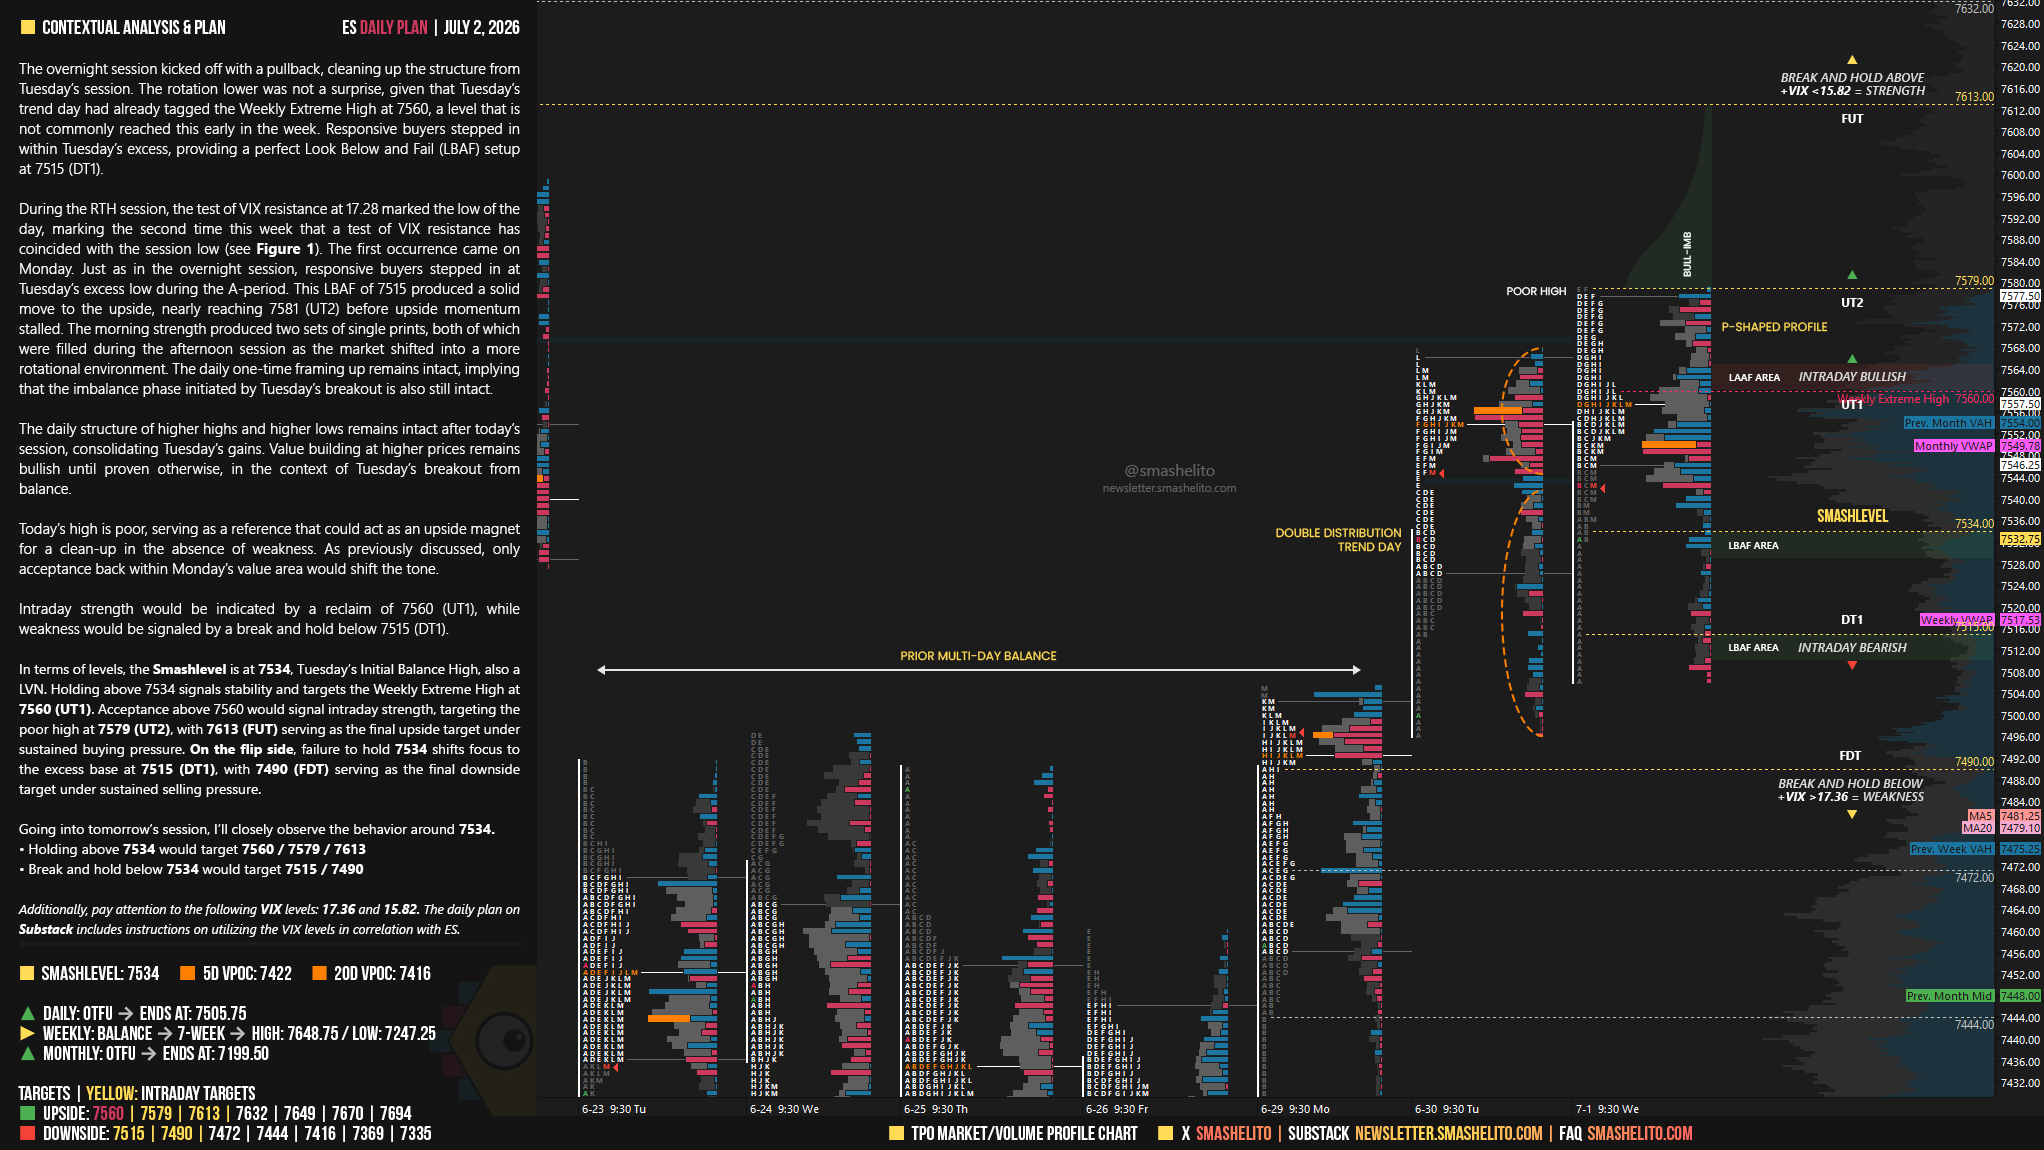
The overnight session kicked off with a pullback, cleaning up the structure from Tuesday’s session. The rotation lower was not a surprise, given that Tuesday’s trend day had already tagged the Weekly Extreme High at 7560, a level that is not commonly reached this early in the week. Responsive buyers stepped in within Tuesday’s excess, providing a perfect Look Below and Fail (LBAF) setup at 7515 (DT1).
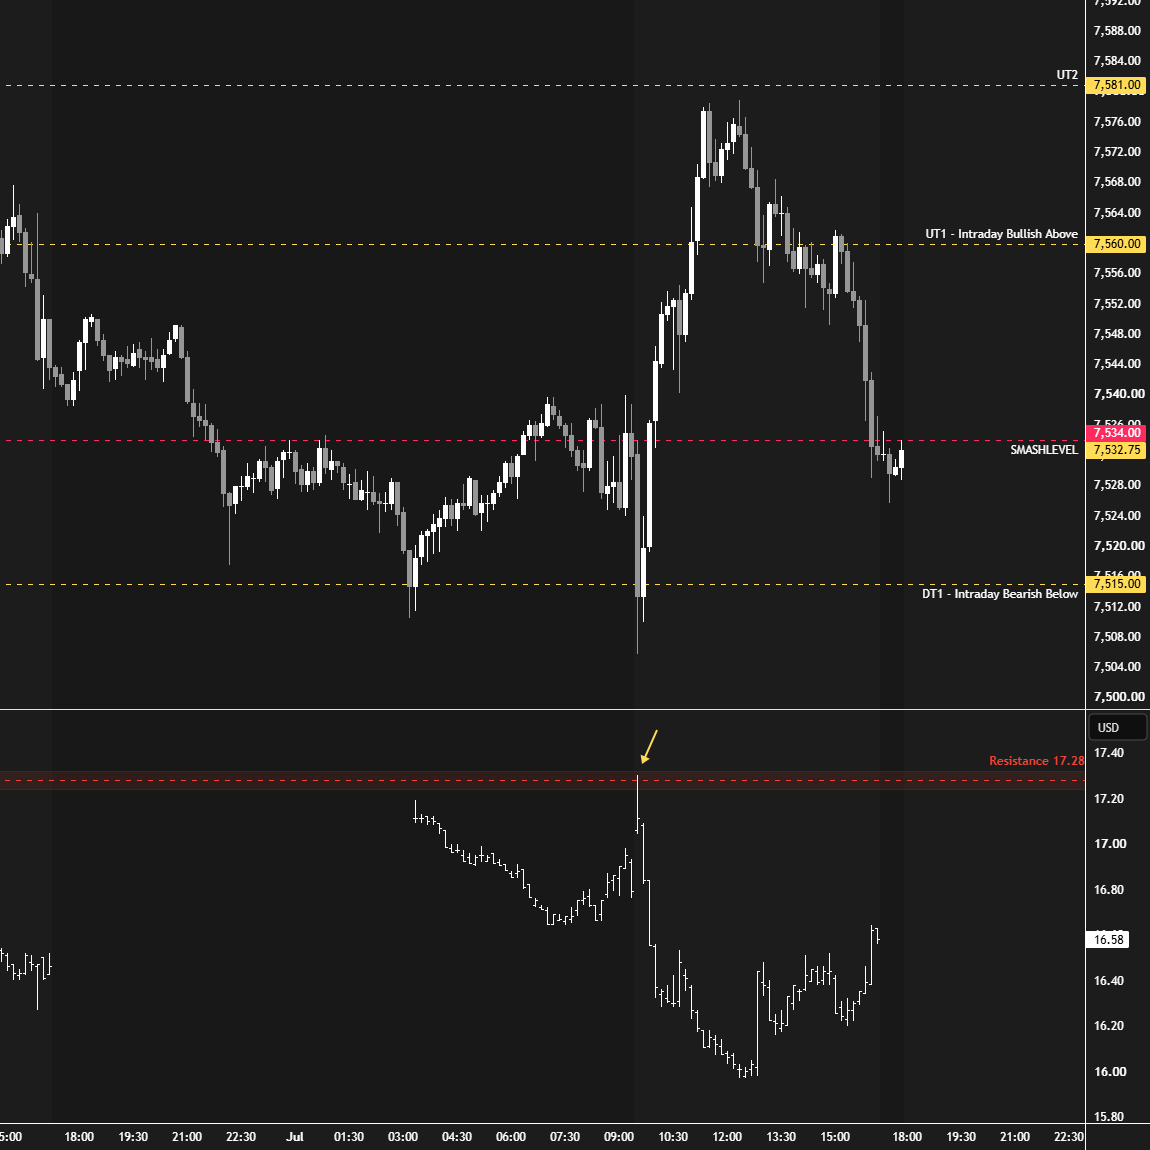
During the RTH session, the test of VIX resistance at 17.28 marked the low of the day, marking the second time this week that a test of VIX resistance has coincided with the session low (see Figure 1). The first occurrence came on Monday. Just as in the overnight session, responsive buyers stepped in at Tuesday’s excess low during the A-period. This LBAF of 7515 produced a solid move to the upside, nearly reaching 7581 (UT2) before upside momentum stalled. The morning strength produced two sets of single prints, both of which were filled during the afternoon session as the market shifted into a more rotational environment. The daily one-time framing up remains intact, implying that the imbalance phase initiated by Tuesday’s breakout is also still intact.
Smashlevels Recap
The daily structure of higher highs and higher lows remains intact after today’s session, consolidating Tuesday’s gains. Value building at higher prices remains bullish until proven otherwise, in the context of Tuesday’s breakout from balance.
Today’s high is poor, serving as a reference that could act as an upside magnet for a clean-up in the absence of weakness. As previously discussed, only acceptance back within Monday’s value area would shift the tone.
Intraday strength would be indicated by a reclaim of 7560 (UT1), while weakness would be signaled by a break and hold below 7515 (DT1).
In terms of levels, the Smashlevel is at 7534, Tuesday’s Initial Balance High, also a LVN. Holding above 7534 signals stability and targets the Weekly Extreme High at 7560 (UT1). Acceptance above 7560 would signal intraday strength, targeting the poor high at 7579 (UT2), with 7613 (FUT) serving as the final upside target under sustained buying pressure.
On the flip side, failure to hold 7534 shifts focus to the excess base at 7515 (DT1), with 7490 (FDT) serving as the final downside target under sustained selling pressure.
Visual Representation
Levels of Interest
Going into tomorrow’s session, I’ll closely observe the behavior around 7534.
Holding above 7534 would target 7560 / 7579 / 7613
Break and hold below 7534 would target 7515 / 7490
Additionally, pay attention to the following VIX levels: 17.36 and 15.82. These levels can provide confirmation of strength or weakness.
Break and hold above 7613 with VIX below 15.82 would confirm strength.
Break and hold below 7490 with VIX above 17.36 would confirm weakness.
Overall, it's important to exercise caution when trading outside of the highlighted yellow levels. A non-cooperative VIX may suggest possible reversals i.e trade setups.
Killing it! Thank you!
Thanks Smash. Have a great weekend.