
ES Daily Plan | July 18, 2025
Market Context & Key Levels for the Day Ahead

— For new subscribers
The yellow levels highlighted at the bottom left of the chart are the primary intraday levels I focus on. To avoid impulsive decisions at poor trade locations, I follow a simple but effective rule: exercise caution when initiating trades outside of these yellow levels.
This means I’m cautious about chasing longs above the Final Upside Target (FUT) and shorts below the Final Downside Target (FDT). It’s important to understand that not chasing does not imply initiating a trade in the opposite direction — discipline over impulse.
Be sure to review the ES Weekly Plan | July 14-18, 2025 for a broader perspective, key levels, and market expectations for the week ahead.
Contextual Analysis & Plan
The Smashlevel at 6291 was notable, serving as both Tuesday’s spike base and aligning closely with Wednesday’s afternoon pullback low. It was tested during the overnight session, where buyers stepped in to defend it—establishing the low of the full session. The next level of interest, 6315 (UT1), was tagged ahead of the RTH open, providing a pullback.
The RTH session was characterized by strength, opening at the upper end of Wednesday’s range and quickly reclaiming the 6315 level. Sellers’ inability to push price back within the prior day’s range set the stage for bullish price action—opening the door for a fill of Tuesday’s excess high and a test of the multi-day balance high. Change took place in the D-period, as the initial balance was extended to the upside, forming single prints and establishing a double distribution. Buyers built on this strength, creating a triple distribution when the J-period broke out of the previous week’s range. A new all-time high was printed at 6345.50, cleaning up the overnight ATH at 6343 in the process.
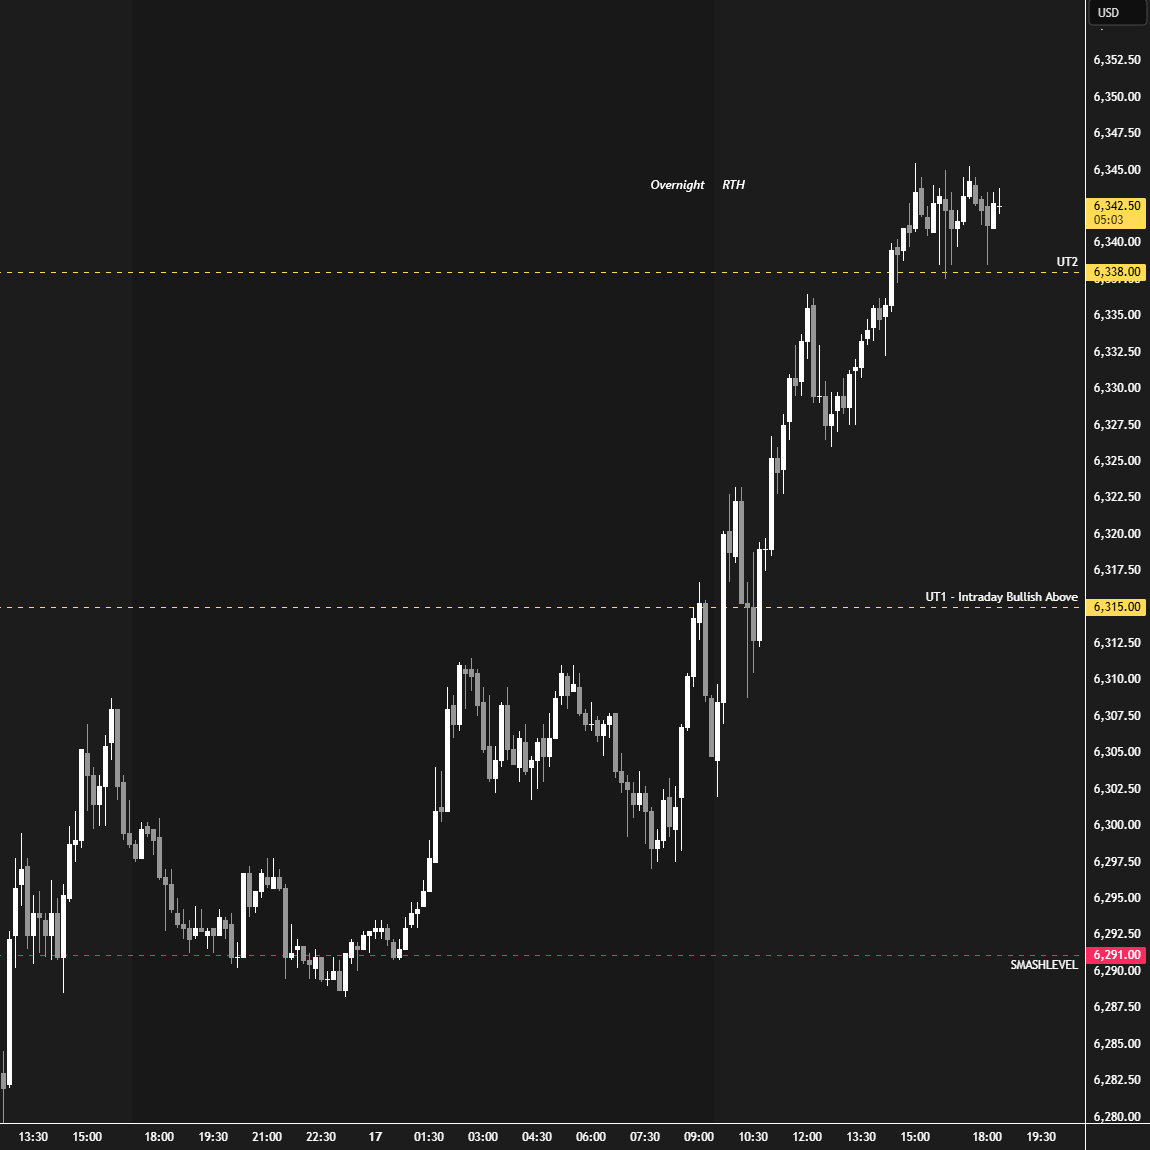
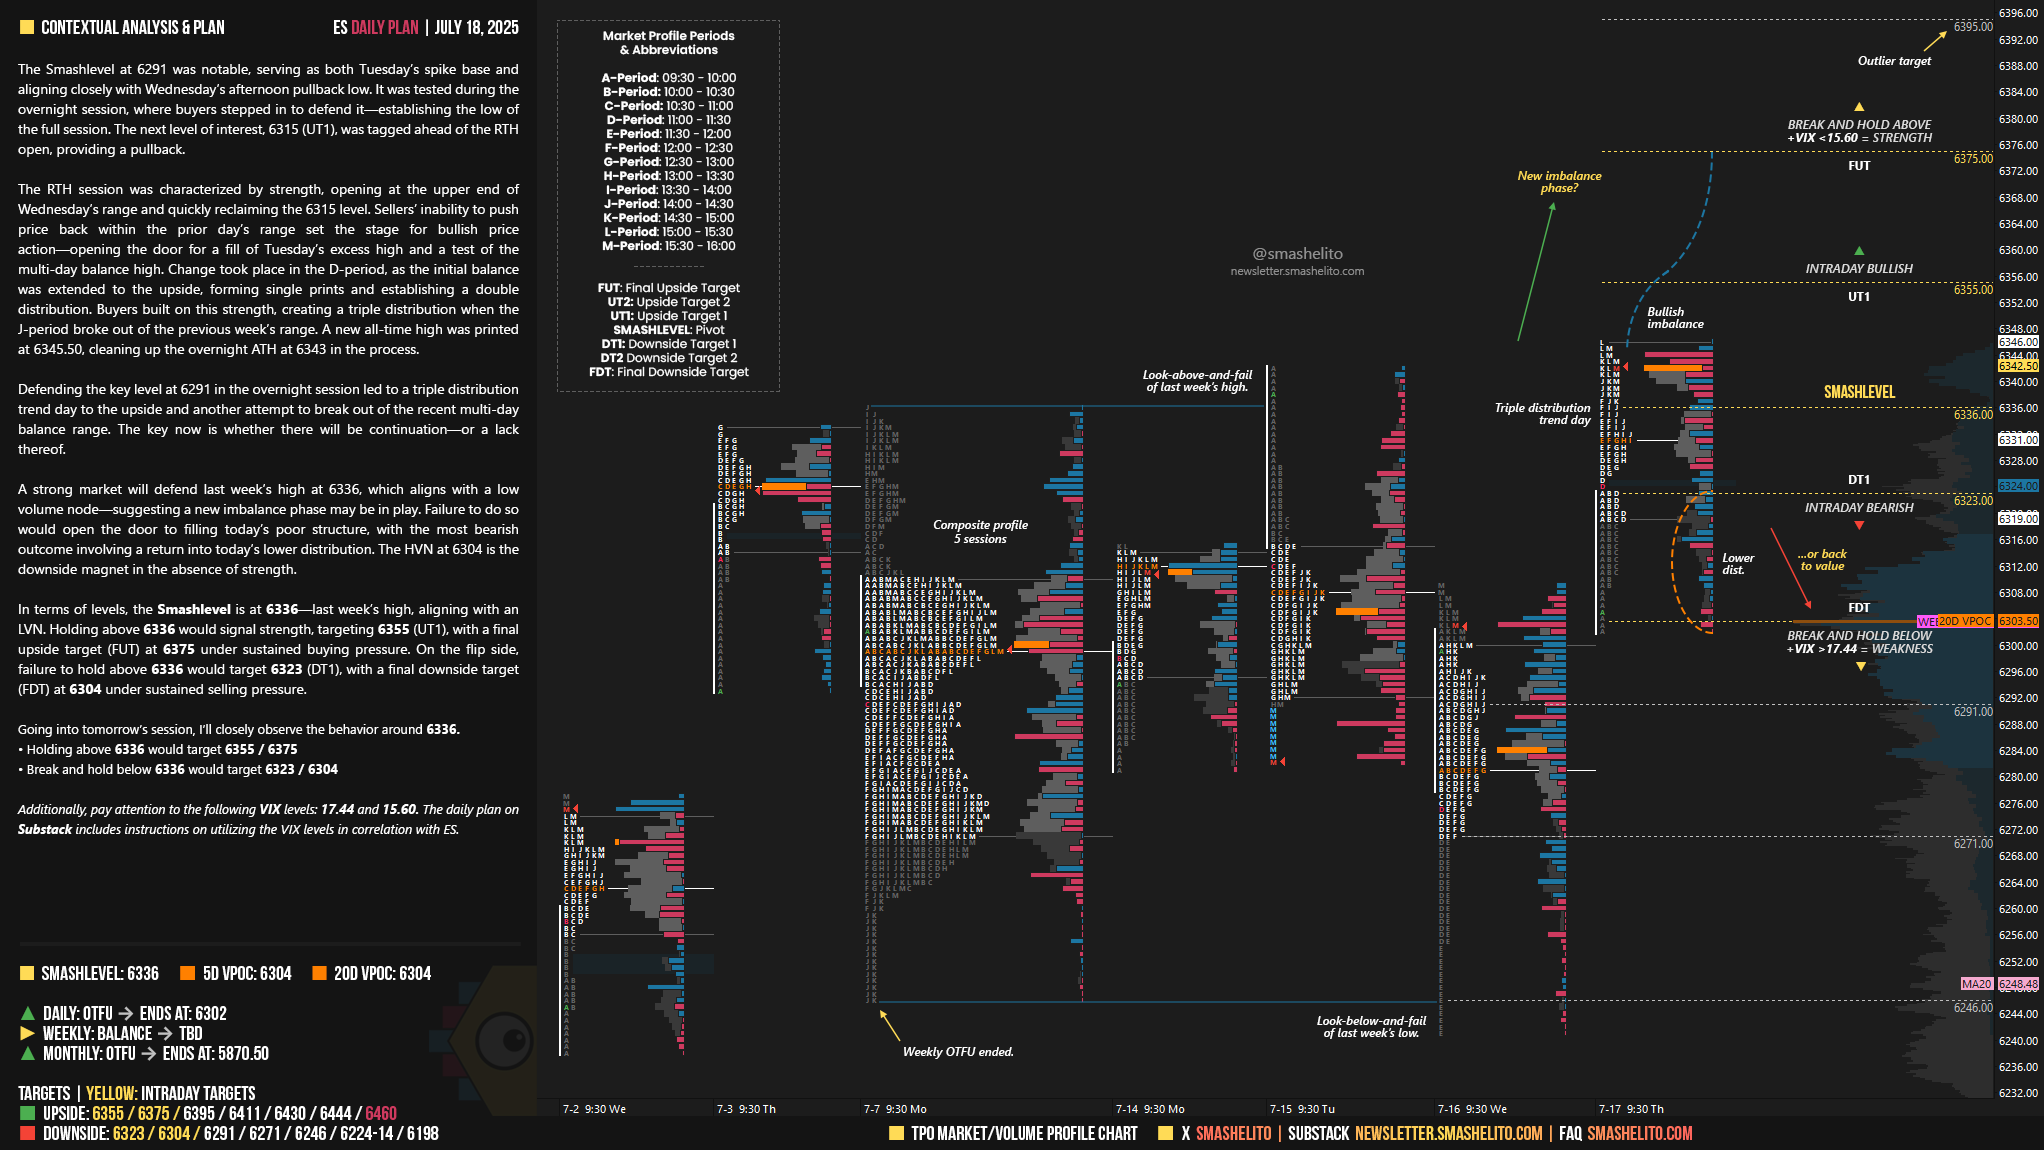
Defending the key level at 6291 in the overnight session led to a triple distribution trend day to the upside and another attempt to break out of the recent multi-day balance range. The key now is whether there will be continuation—or a lack thereof.
A strong market will defend last week’s high at 6336, which aligns with a low volume node—suggesting a new imbalance phase may be in play. Failure to do so would open the door to filling today’s poor structure, with the most bearish outcome involving a return into today’s lower distribution. The HVN at 6304 is the downside magnet in the absence of strength.
In terms of levels, the Smashlevel is at 6336—last week’s high, aligning with an LVN. Holding above 6336 would signal strength, targeting 6355 (UT1), with a final upside target (FUT) at 6375 under sustained buying pressure.
On the flip side, failure to hold above 6336 would target 6323 (DT1), with a final downside target (FDT) at 6304 under sustained selling pressure.
Levels of Interest
Going into tomorrow’s session, I’ll closely observe the behavior around 6336.
Holding above 6336 would target 6355 / 6375
Break and hold below 6336 would target 6323 / 6304
Additionally, pay attention to the following VIX levels: 17.44 and 15.60. These levels can provide confirmation of strength or weakness.
Break and hold above 6375 with VIX below 15.60 would confirm strength.
Break and hold below 6304 with VIX above 17.44 would confirm weakness.
Overall, it's important to exercise caution when trading outside of the highlighted yellow levels. A non-cooperative VIX may suggest possible reversals i.e trade setups.
Thank you for yet another clear daily plan! Helps out tremendously!
Smash levels still GOAT’d. Thank you!