
ES Daily Plan | July 17, 2025
Market Context & Key Levels for the Day Ahead

— For new subscribers
The yellow levels highlighted at the bottom left of the chart are the primary intraday levels I focus on. To avoid impulsive decisions at poor trade locations, I follow a simple but effective rule: exercise caution when initiating trades outside of these yellow levels.
This means I’m cautious about chasing longs above the Final Upside Target (FUT) and shorts below the Final Downside Target (FDT). It’s important to understand that not chasing does not imply initiating a trade in the opposite direction — discipline over impulse.
Be sure to review the ES Weekly Plan | July 14-18, 2025 for a broader perspective, key levels, and market expectations for the week ahead.
Contextual Analysis & Plan
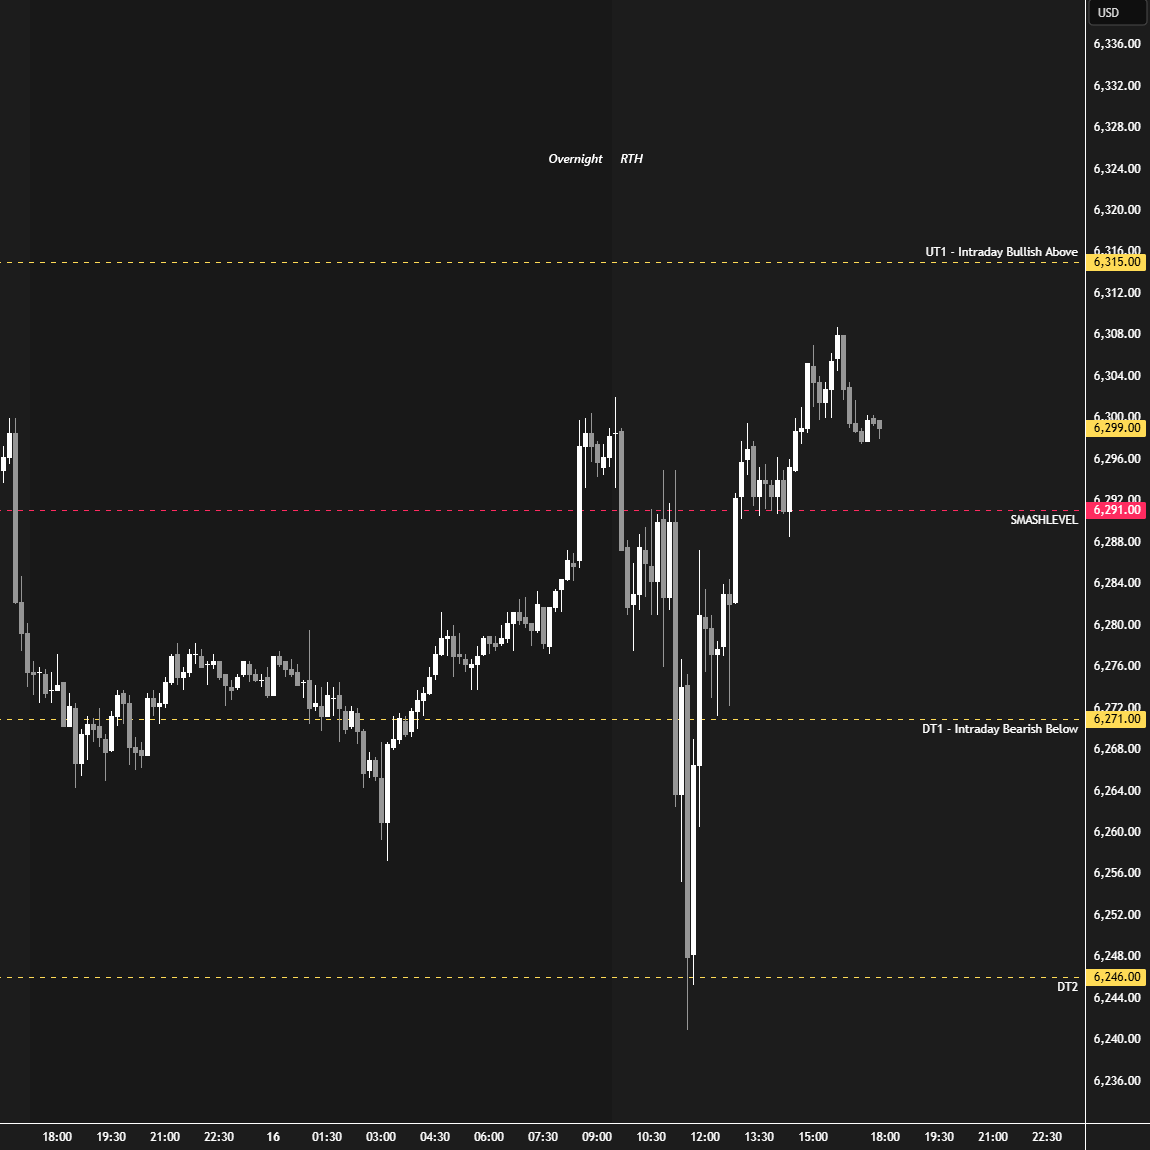
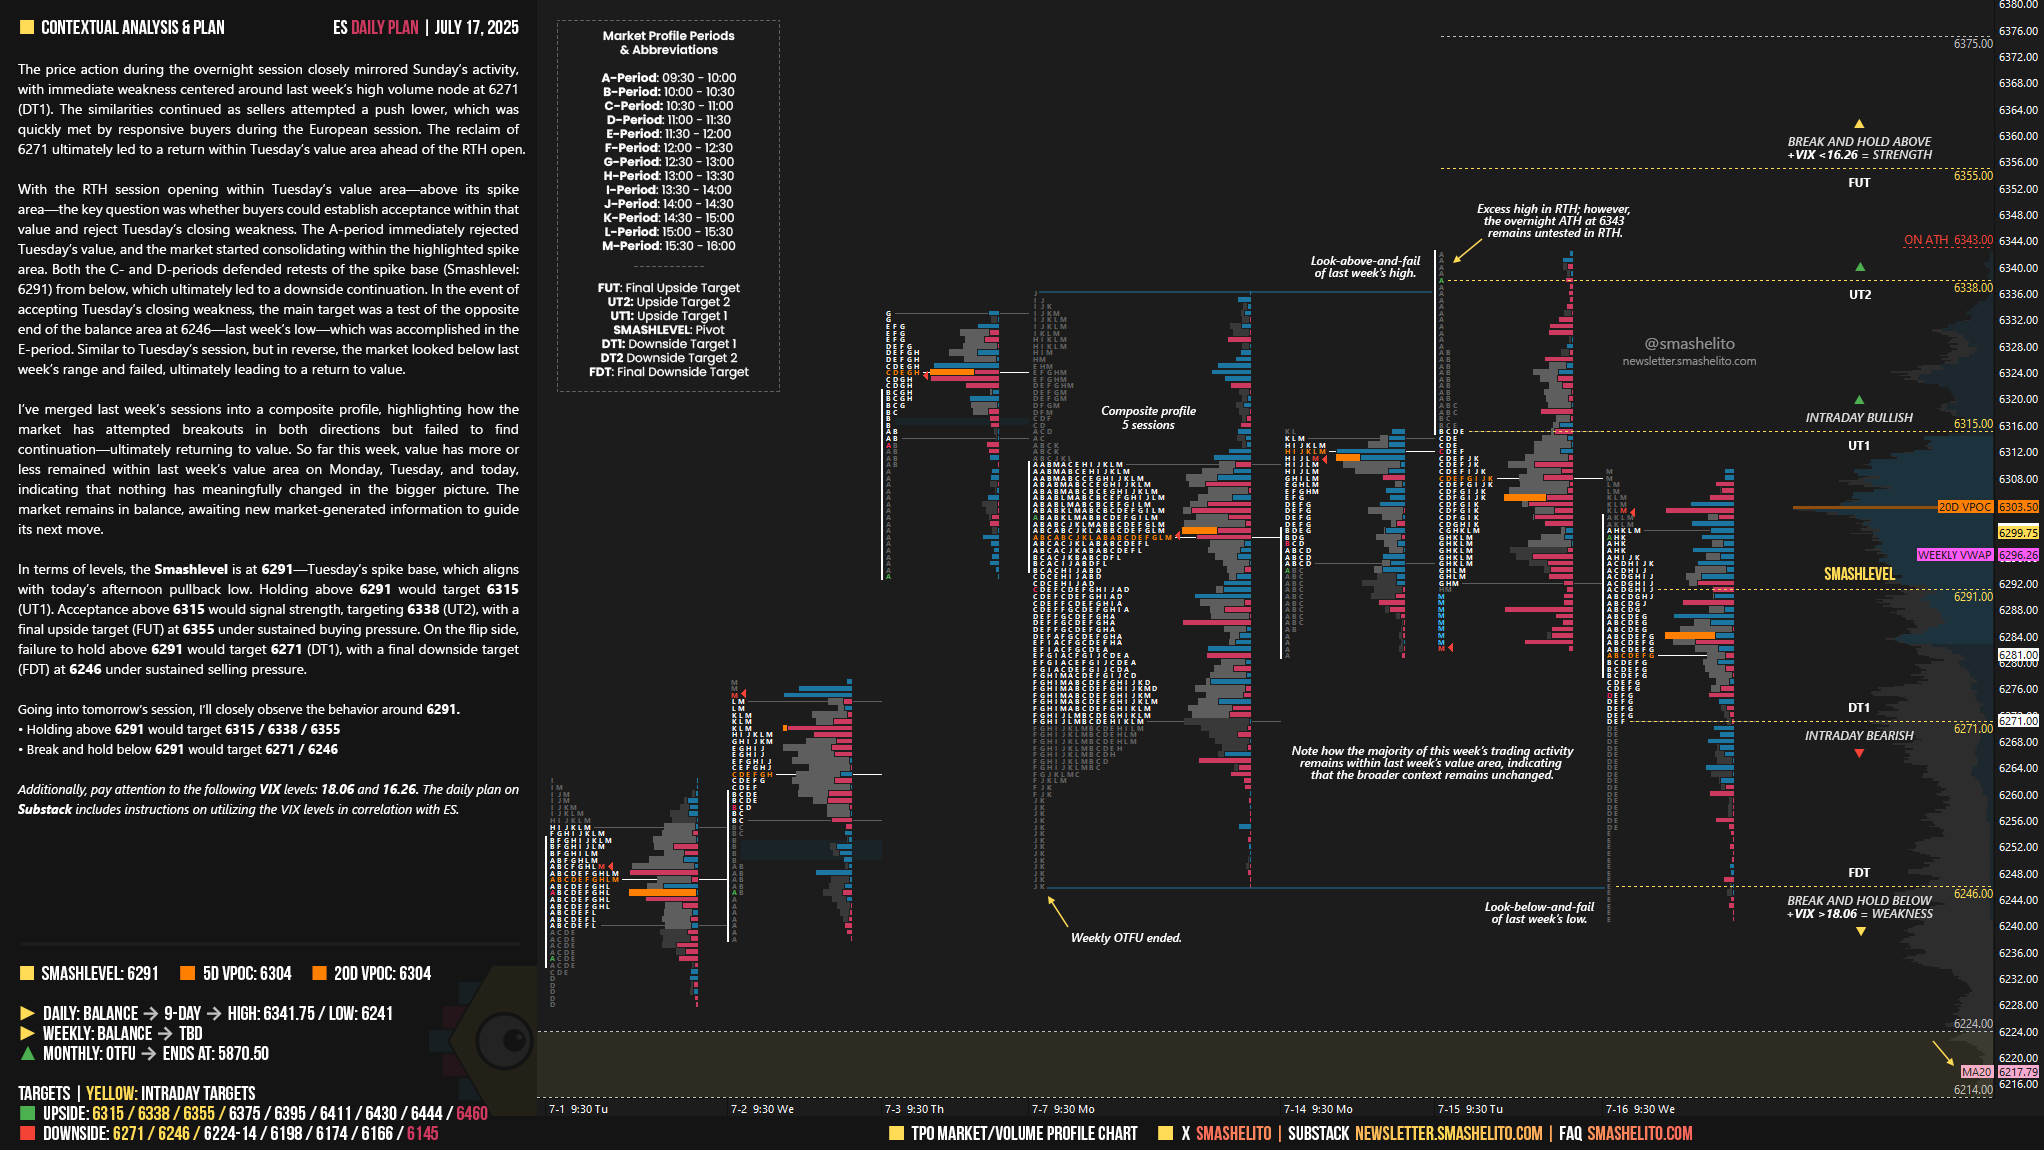
The price action during the overnight session closely mirrored Sunday’s activity, with immediate weakness centered around last week’s high volume node at 6271 (DT1). The similarities continued as sellers attempted a push lower, which was quickly met by responsive buyers during the European session. The reclaim of 6271 ultimately led to a return within Tuesday’s value area ahead of the RTH open.
With the RTH session opening within Tuesday’s value area—above its spike area—the key question was whether buyers could establish acceptance within that value and reject Tuesday’s closing weakness. The A-period immediately rejected Tuesday’s value, and the market started consolidating within the highlighted spike area. Both the C- and D-periods defended retests of the spike base (Smashlevel: 6291) from below, which ultimately led to a downside continuation. In the event of accepting Tuesday’s closing weakness, the main target was a test of the opposite end of the balance area at 6246—last week’s low—which was accomplished in the E-period. Similar to Tuesday’s session, but in reverse, the market looked below last week’s range and failed, ultimately leading to a return to value.
I’ve merged last week’s sessions into a composite profile, highlighting how the market has attempted breakouts in both directions but failed to find continuation—ultimately returning to value. So far this week, value has more or less remained within last week’s value area on Monday, Tuesday, and today, indicating that nothing has meaningfully changed in the bigger picture. The market remains in balance, awaiting new market-generated information to guide its next move.
In terms of levels, the Smashlevel is at 6291—Tuesday’s spike base, which aligns with today’s afternoon pullback low. Holding above 6291 would target 6315 (UT1). Acceptance above 6315 would signal strength, targeting 6338 (UT2), with a final upside target (FUT) at 6355 under sustained buying pressure.
On the flip side, failure to hold above 6291 would target 6271 (DT1), with a final downside target (FDT) at 6246 under sustained selling pressure.
Levels of Interest
Going into tomorrow’s session, I’ll closely observe the behavior around 6291.
Holding above 6291 would target 6315 / 6338 / 6355
Break and hold below 6291 would target 6271 / 6246
Additionally, pay attention to the following VIX levels: 18.06 and 16.26. These levels can provide confirmation of strength or weakness.
Break and hold above 6355 with VIX below 16.26 would confirm strength.
Break and hold below 6246 with VIX above 18.06 would confirm weakness.
Overall, it's important to exercise caution when trading outside of the highlighted yellow levels. A non-cooperative VIX may suggest possible reversals i.e trade setups.
Been reading you for a while and wanted to thank you for your work. In addition to learning from the analysis itself, I've been learning a lot from the language that you use to describe the market. Thanks and keep up the good work.
Bro describe on market profile like a master 🙏🏻