

— For new subscribers
The yellow levels highlighted at the bottom left of the chart are the primary intraday levels I focus on. To avoid impulsive decisions at poor trade locations, I follow a simple but effective rule: exercise caution when initiating trades outside of these yellow levels.
This means I’m cautious about chasing longs above the Final Upside Target (FUT) and shorts below the Final Downside Target (FDT). It’s important to understand that not chasing does not imply initiating a trade in the opposite direction. Discipline over impulse.
Be sure to review the Weekly Plan for a broader perspective, key levels, and market expectations for the week ahead.

Contextual Analysis & Plan
Buyers struggled to gain meaningful traction above 7605 (Smashlevel) overnight, opening the door to weakness as Friday’s breakout attempt from balance came under immediate pressure. In the process, Friday’s rather large excess low was revisited, where responsive buyers emerged following a Look Below and Fail (LBAF) of 7579 (DT1).
The 7605 level was revisited ahead of the RTH open and tested again shortly after the open, where sellers stepped in. The morning session was marked by responsive sellers on attempts to reclaim 7605, and buyers stepping in at the 7579 level. The failed breakout scenario in play was accompanied by VIX holding above its resistance level at 15.78, adding downside pressure.
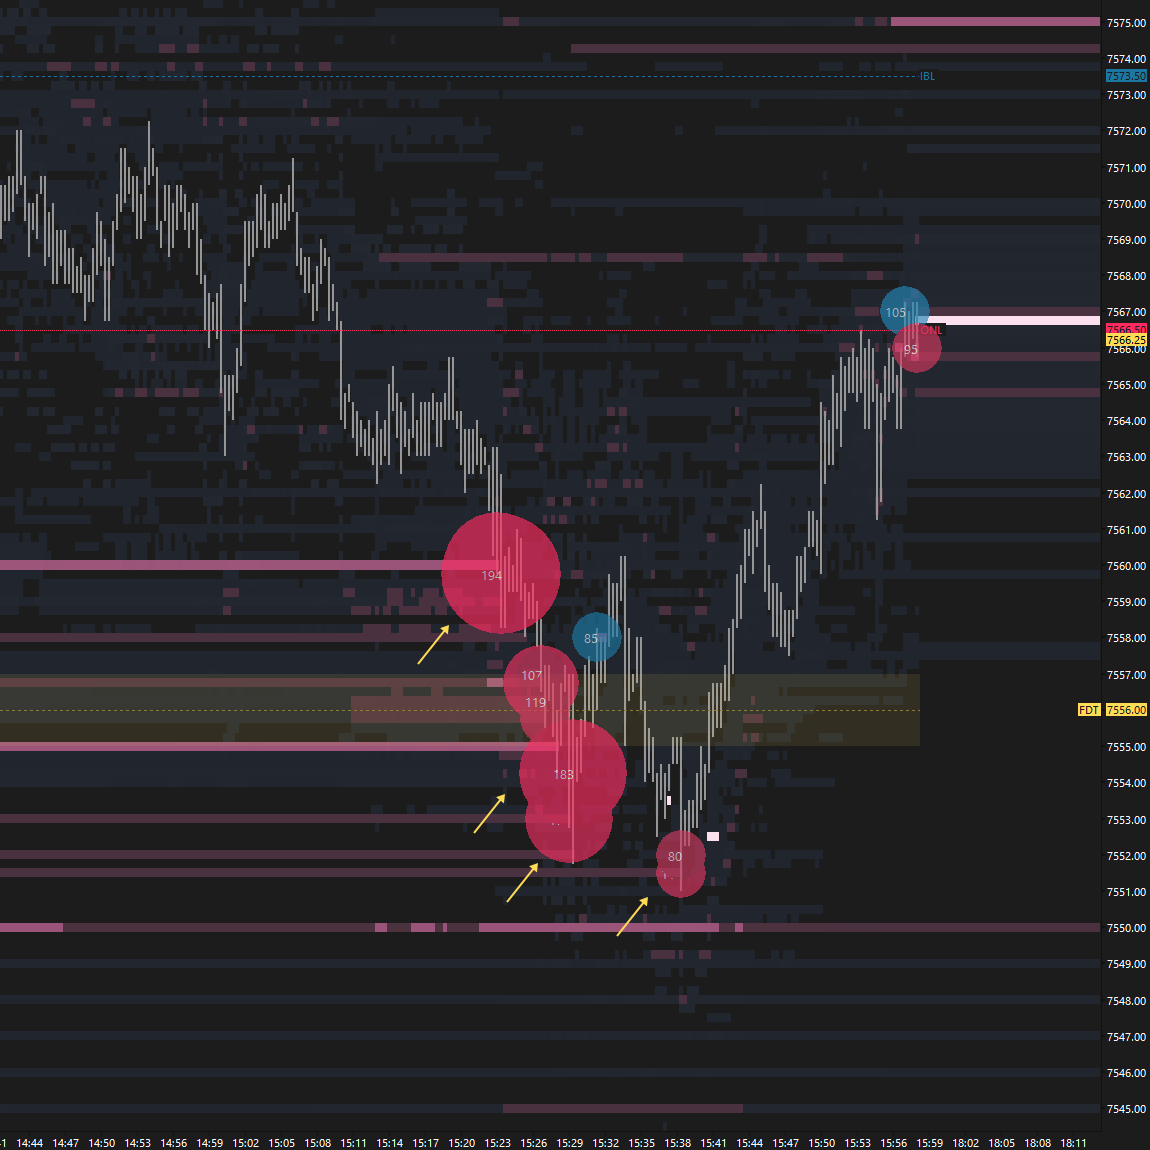
The change took place in the G-period, once 7579 was breached and then reoffered. Following this, buyers were unable to reclaim the Initial Balance low, ultimately leading to a tag of the HVN at 7556 (FDT), which was the downside magnet following the failure to sustain Friday’s breakout. A return to this HVN provided a great opportunity to book profits if short, making it an unfavorable location to initiate new shorts. There was notable order flow activity around the 7556 level (see Figure 1), and aggressive sellers entering at this unfavorable location were squeezed into the close.
Session Recap
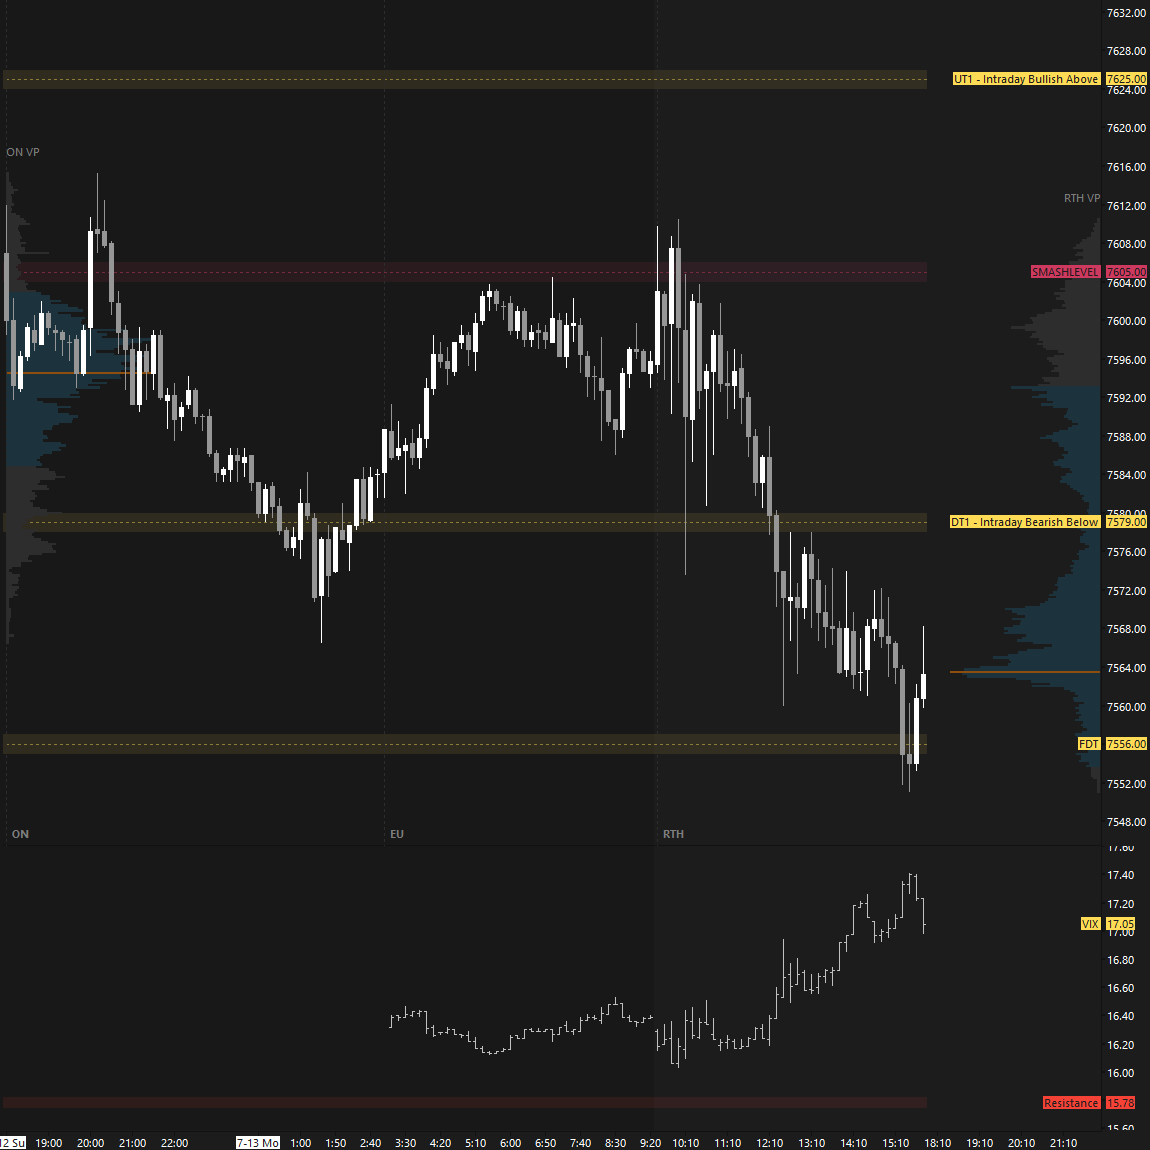
Today’s session was a great example of auction dynamics: markets transition from balance to imbalance, but when the imbalance fails, price often returns to the prior balance area where value was established, in this case, the HVN at 7556.
The key question now is whether the failed breakout will lead to a rotation toward the opposite side of the range, or whether buyers can invalidate this expected behavior.
Intraday strength would be indicated by a reclaim of 7579 (UT1), while weakness would be signaled by a break and hold below 7532 (DT1).
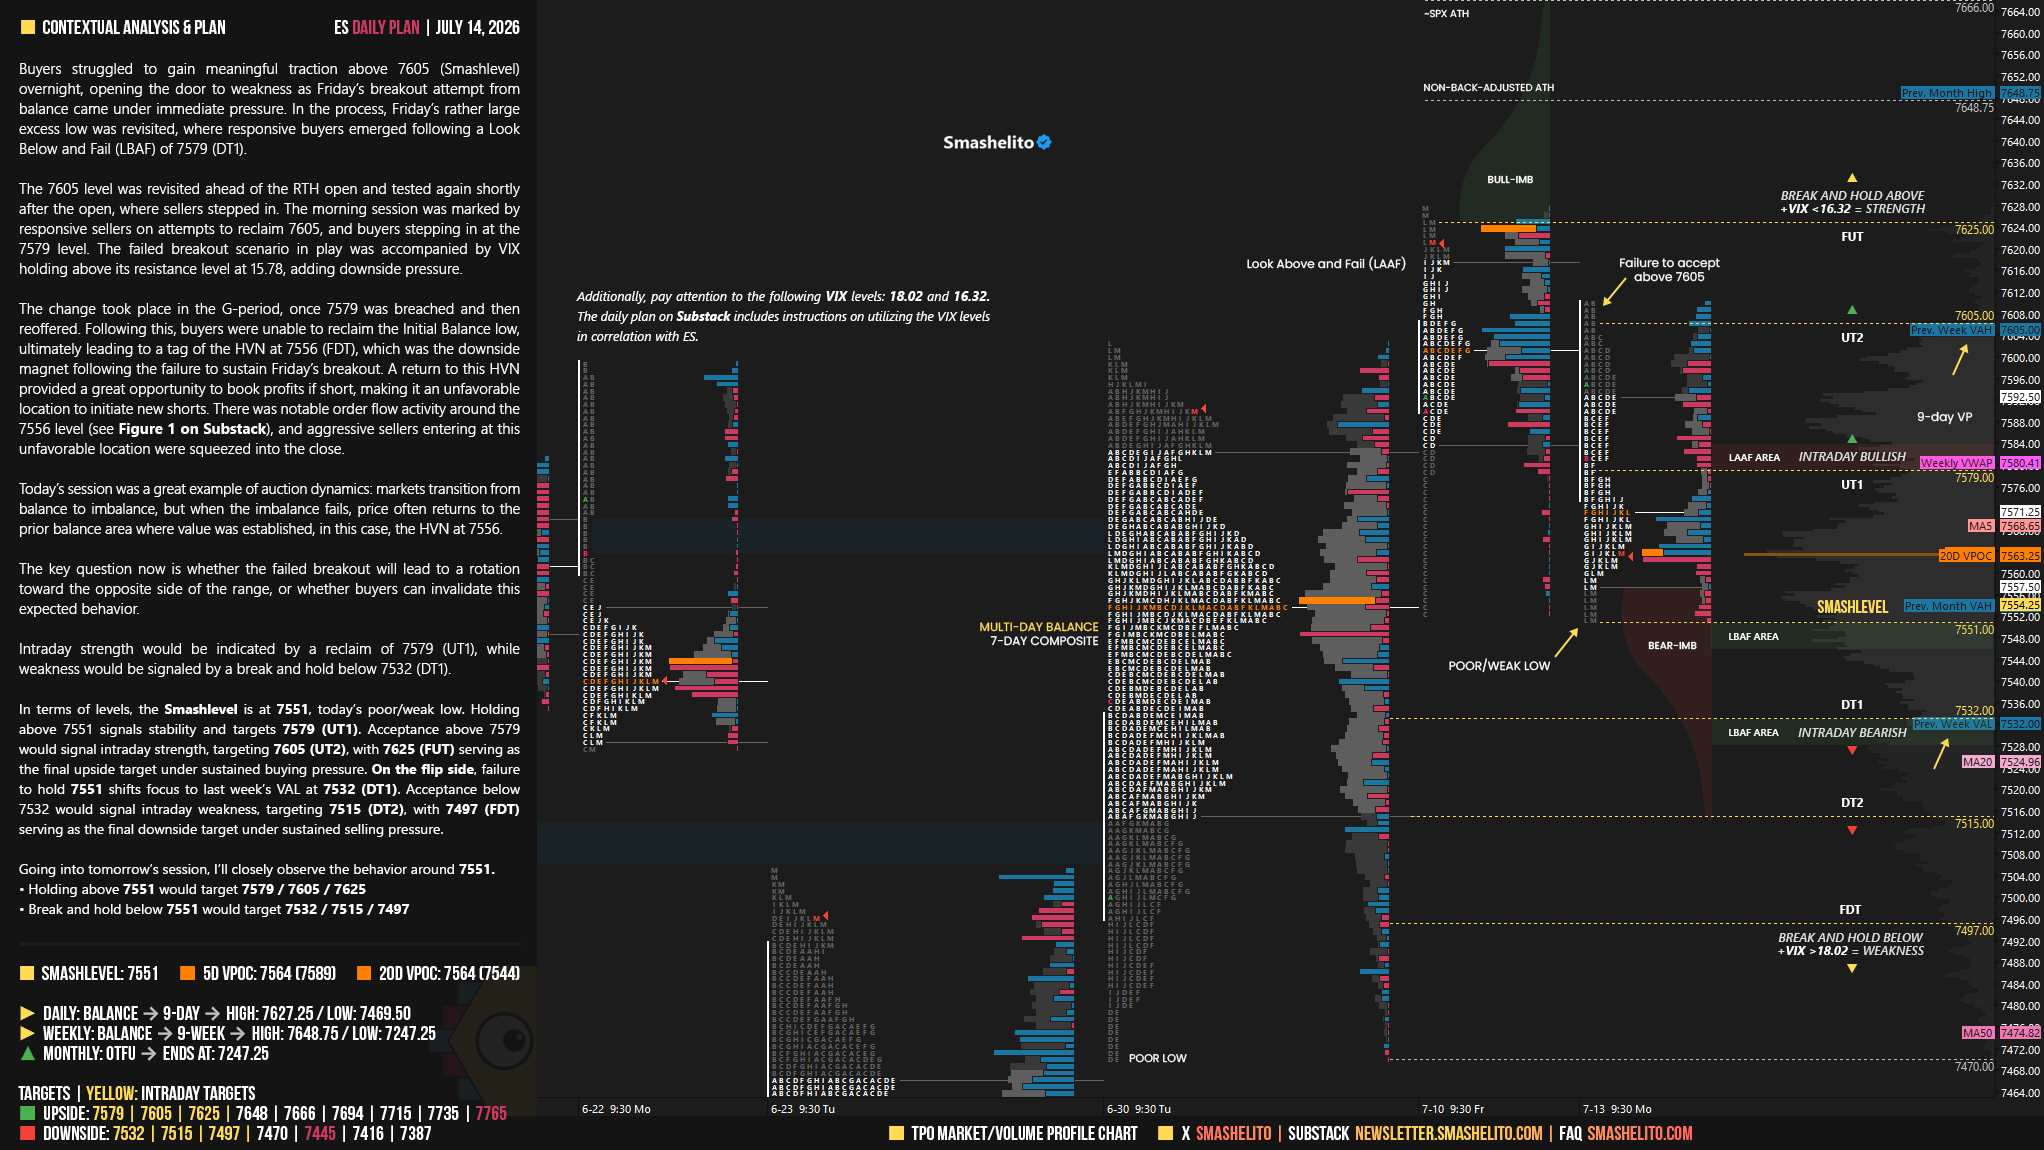
In terms of levels, the Smashlevel is at 7551, today’s poor/weak low. Holding above 7551 signals stability and targets 7579 (UT1). Acceptance above 7579 would signal intraday strength, targeting 7605 (UT2), with 7625 (FUT) serving as the final upside target under sustained buying pressure.
On the flip side, failure to hold 7551 shifts focus to last week’s VAL at 7532 (DT1). Acceptance below 7532 would signal intraday weakness, targeting 7515 (DT2), with 7497 (FDT) serving as the final downside target under sustained selling pressure.
Visual Representation
Levels of Interest
Going into tomorrow’s session, I’ll closely observe the behavior around 7551.
Holding above 7551 would target 7579 / 7605 / 7625
Break and hold below 7551 would target 7532 / 7515 / 7497
Additionally, pay attention to the following VIX levels: 18.02 and 16.32 These levels can provide confirmation of strength or weakness.
Break and hold above 7625 with VIX below 16.32 would confirm strength.
Break and hold below 7497 with VIX above 18.02 would confirm weakness.
Overall, it's important to exercise caution when trading outside of the highlighted yellow levels. A non-cooperative VIX may suggest possible reversals i.e trade setups.
We're starting to build up value for the next move, a pattern you always notice when VPOCs rotate at the same price.
Thanks for everything!
Thanks smash!