
ES Daily Plan | July 14, 2025
Market Context & Key Levels for the Day Ahead

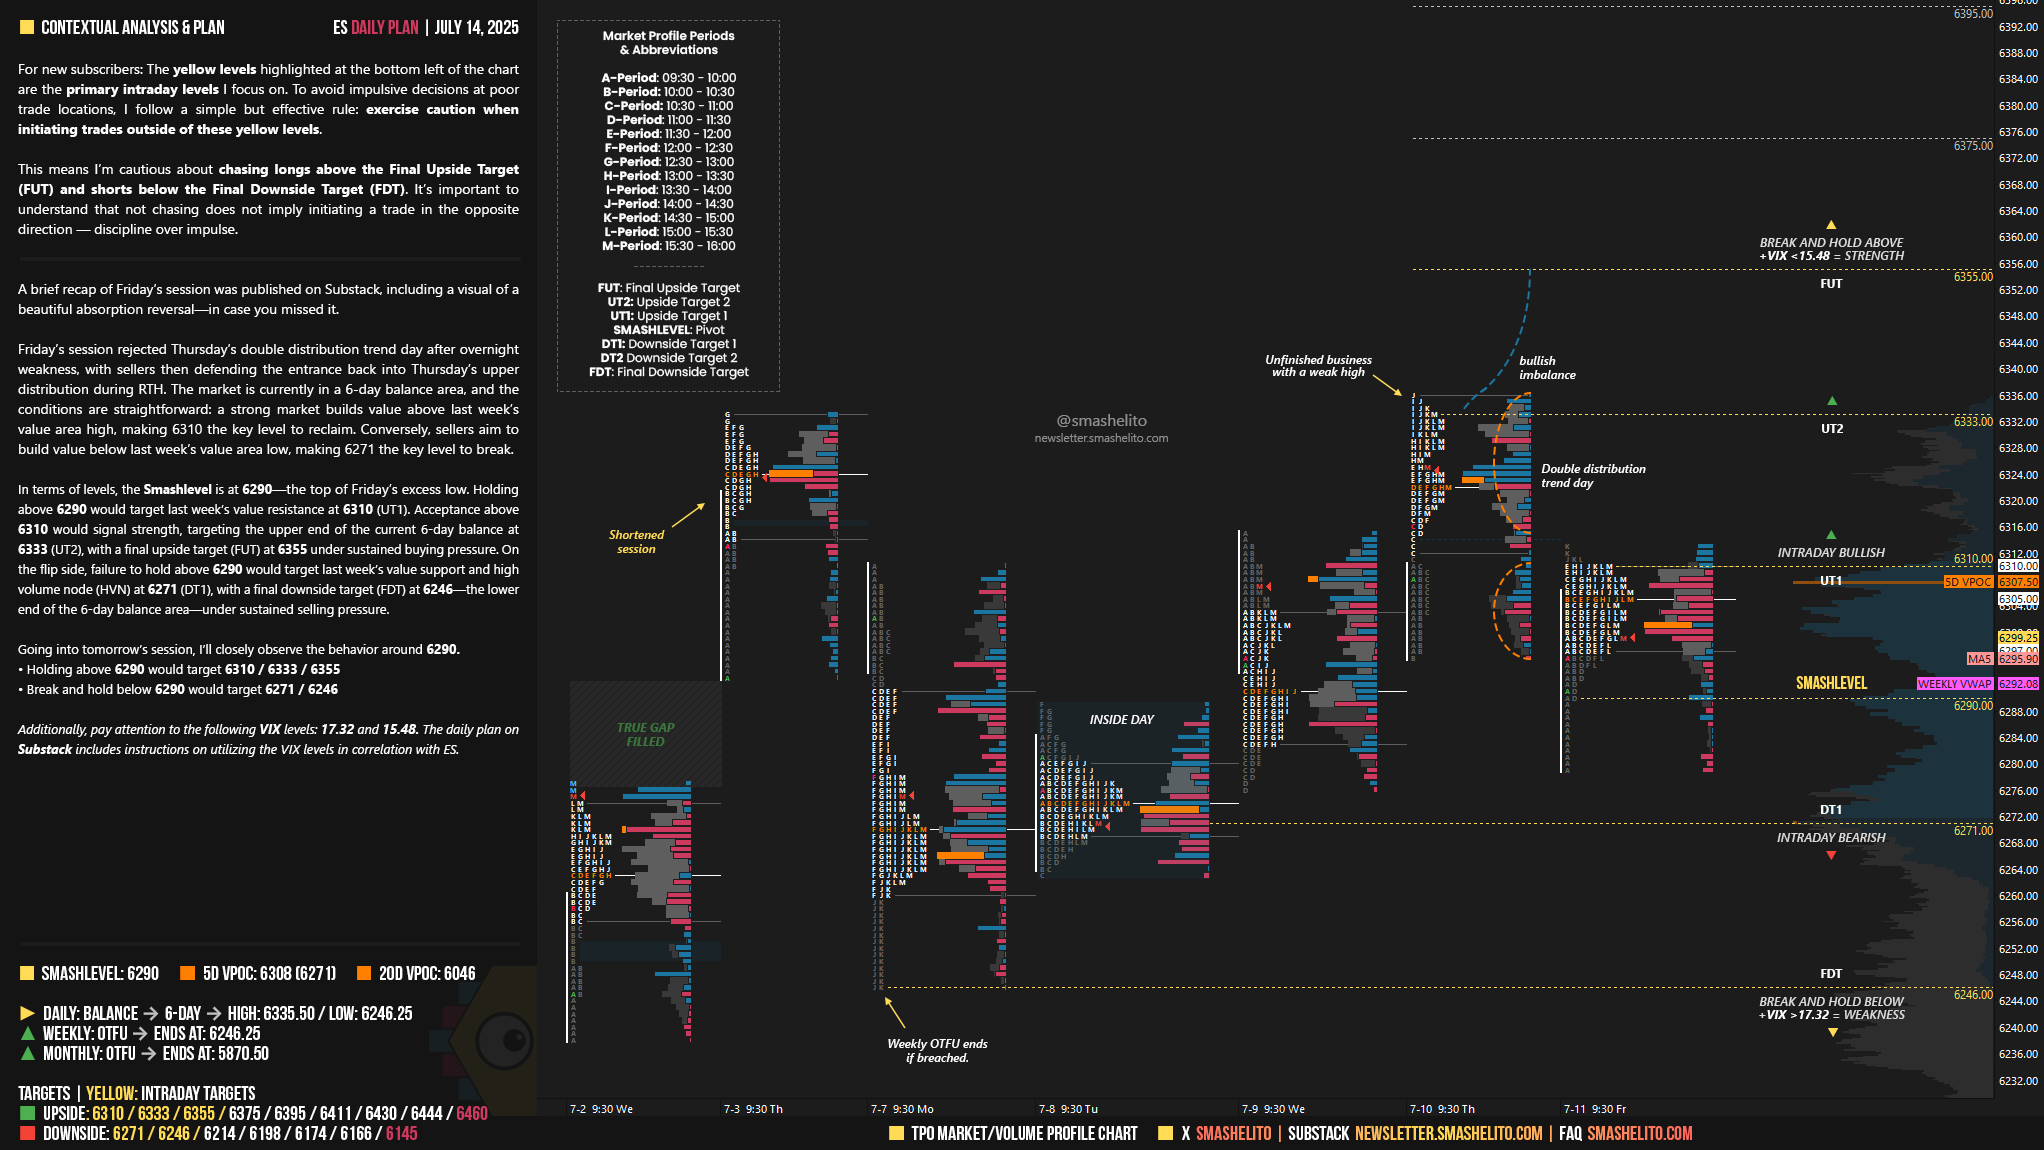
— For new subscribers
The yellow levels highlighted at the bottom left of the chart are the primary intraday levels I focus on. To avoid impulsive decisions at poor trade locations, I follow a simple but effective rule: exercise caution when initiating trades outside of these yellow levels.
This means I’m cautious about chasing longs above the Final Upside Target (FUT) and shorts below the Final Downside Target (FDT). It’s important to understand that not chasing does not imply initiating a trade in the opposite direction — discipline over impulse.
Be sure to review the ES Weekly Plan | July 14-18, 2025 for a broader perspective, key levels, and market expectations for the week ahead.
Contextual Analysis & Plan
A brief recap of Friday’s session was published on Substack (link), including a visual of a beautiful absorption reversal—in case you missed it.
Friday’s session rejected Thursday’s double distribution trend day after overnight weakness, with sellers then defending the entrance back into Thursday’s upper distribution during RTH. The market is currently in a 6-day balance area, and the conditions are straightforward: a strong market builds value above last week’s value area high, making 6310 the key level to reclaim. Conversely, sellers aim to build value below last week’s value area low, making 6271 the key level to break.
In terms of levels, the Smashlevel is at 6290—the top of Friday’s excess low. Holding above 6290 would target last week’s value resistance at 6310 (UT1). Acceptance above 6310 would signal strength, targeting the upper end of the current 6-day balance at 6333 (UT2), with a final upside target (FUT) at 6355 under sustained buying pressure.
On the flip side, failure to hold above 6290 would target last week’s value support and high volume node (HVN) at 6271 (DT1), with a final downside target (FDT) at 6246—the lower end of the 6-day balance area—under sustained selling pressure.
Levels of Interest
Going into tomorrow’s session, I’ll closely observe the behavior around 6290.
Holding above 6290 would target 6310 / 6333 / 6355
Break and hold below 6290 would target 6271 / 6246
Additionally, pay attention to the following VIX levels: 17.32 and 15.48. These levels can provide confirmation of strength or weakness.
Break and hold above 6355 with VIX below 15.48 would confirm strength.
Break and hold below 6246 with VIX above 17.32 would confirm weakness.
Overall, it's important to exercise caution when trading outside of the highlighted yellow levels. A non-cooperative VIX may suggest possible reversals i.e trade setups.
Thank you!
Muchas Gracias, Smashelito y feliz tardes des Domingo.