

— For new subscribers
The yellow levels highlighted at the bottom left of the chart are the primary intraday levels I focus on. To avoid impulsive decisions at poor trade locations, I follow a simple but effective rule: exercise caution when initiating trades outside of these yellow levels.
This means I’m cautious about chasing longs above the Final Upside Target (FUT) and shorts below the Final Downside Target (FDT). It’s important to understand that not chasing does not imply initiating a trade in the opposite direction. Discipline over impulse.
Be sure to review the Weekly Plan for a broader perspective, key levels, and market expectations for the week ahead.

Contextual Analysis & Plan
Heading into Friday’s session, the auction had developed a 7-day balance area. Buyers ultimately initiated a breakout from balance, with the intraday levels working exceptionally well throughout the session. See Figure 1 for a brief recap.
Session Recap
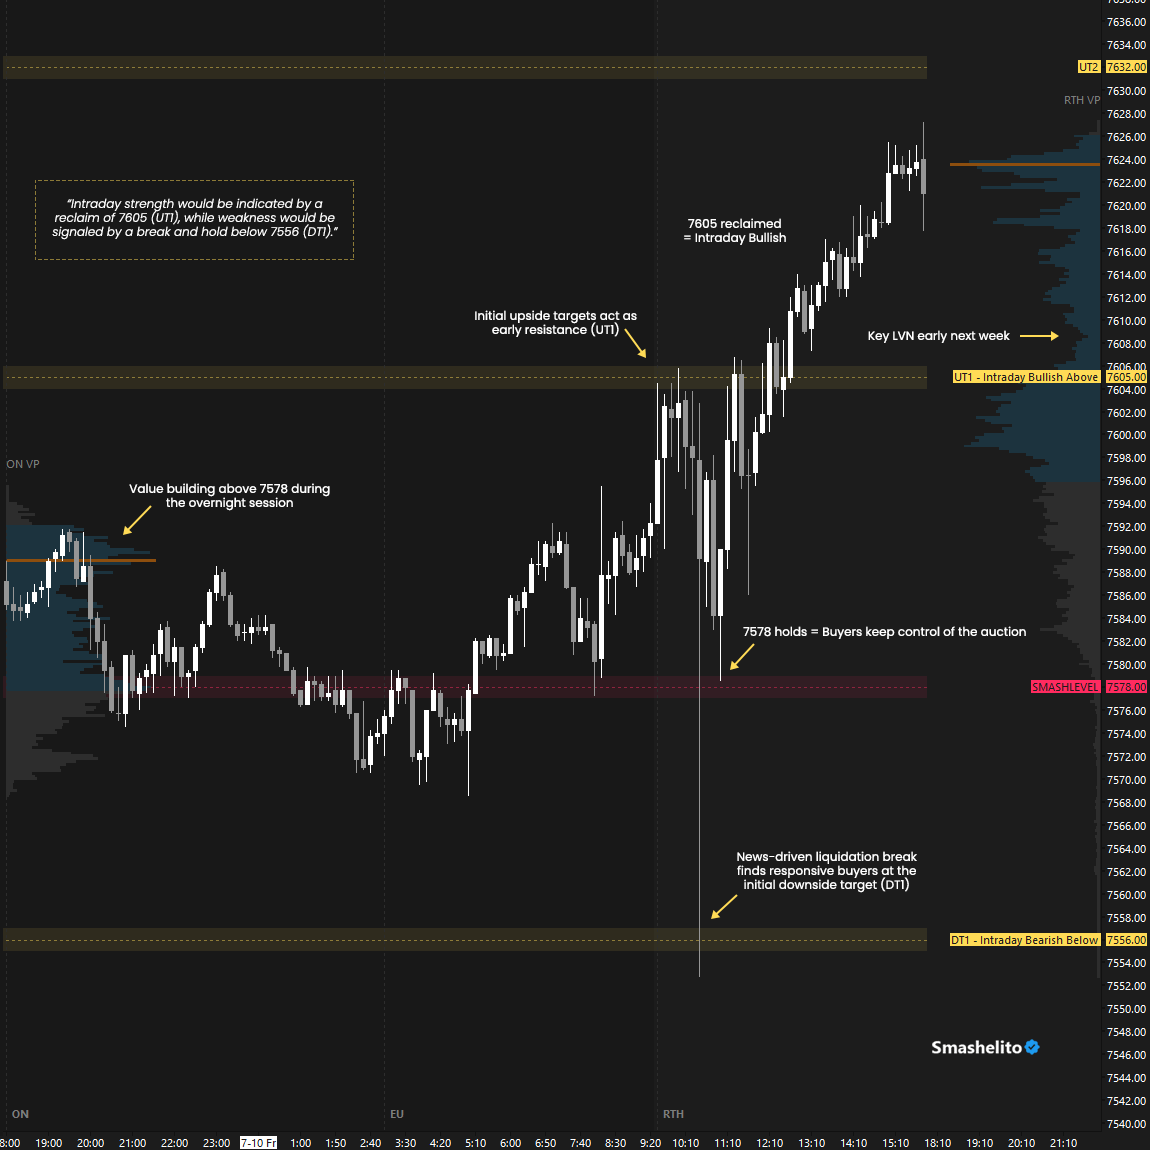
As with any breakout from balance, the key now is to monitor for continuation or lack thereof. A good way to gauge the conviction behind the breakout is by monitoring the auction’s behavior around last week’s VAH at 7605, which aligns with the multi-day balance highs.
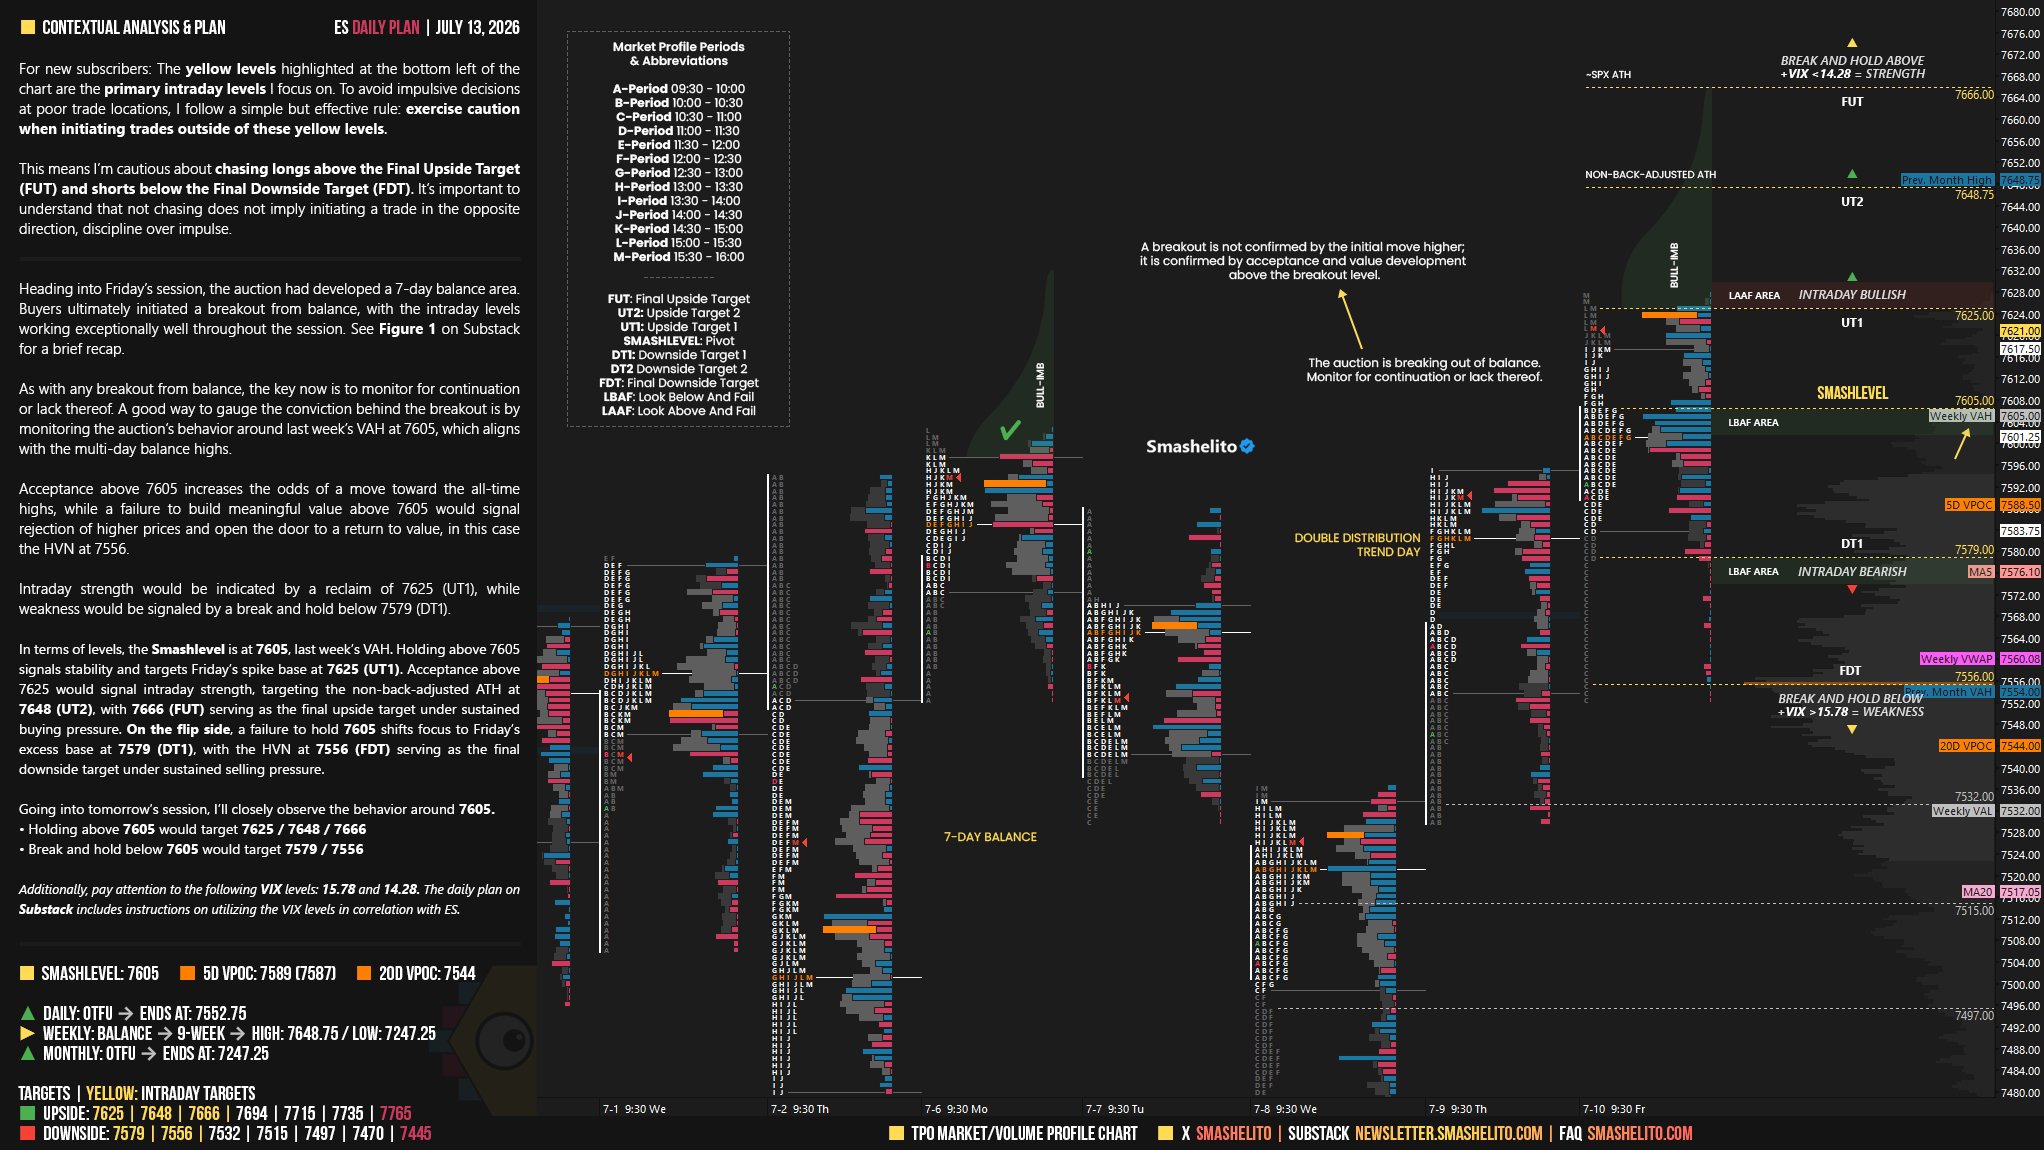
Acceptance above 7605 increases the odds of a move toward the all-time highs, while a failure to build meaningful value above 7605 would signal rejection of higher prices and open the door to a return to value, in this case the HVN at 7556.
Intraday strength would be indicated by a reclaim of 7625 (UT1), while weakness would be signaled by a break and hold below 7579 (DT1).
In terms of levels, the Smashlevel is at 7605, last week’s VAH. Holding above 7605 signals stability and targets Friday’s spike base at 7625 (UT1). Acceptance above 7625 would signal intraday strength, targeting the non-back-adjusted ATH at 7648 (UT2), with 7666 (FUT) serving as the final upside target under sustained buying pressure.
On the flip side, a failure to hold 7605 shifts focus to Friday’s excess base at 7579 (DT1), with the HVN at 7556 (FDT) serving as the final downside target under sustained selling pressure.
Visual Representation
Levels of Interest
Going into tomorrow’s session, I’ll closely observe the behavior around 7605.
Holding above 7605 would target 7625 / 7648 / 7666
Break and hold below 7605 would target 7579 / 7556
Additionally, pay attention to the following VIX levels: 15.78 and 14.28. These levels can provide confirmation of strength or weakness.
Break and hold above 7666 with VIX below 14.28 would confirm strength.
Break and hold below 7556 with VIX above 15.78 would confirm weakness.
Overall, it's important to exercise caution when trading outside of the highlighted yellow levels. A non-cooperative VIX may suggest possible reversals i.e trade setups.
Thank you Smash. Wishing you a great week ahead
Thanks Smash!