
ES Daily Plan | July 11, 2025
Market Context & Key Levels for the Day Ahead

— For new subscribers
The yellow levels highlighted at the bottom left of the chart are the primary intraday levels I focus on. To avoid impulsive decisions at poor trade locations, I follow a simple but effective rule: exercise caution when initiating trades outside of these yellow levels.
This means I’m cautious about chasing longs above the Final Upside Target (FUT) and shorts below the Final Downside Target (FDT). It’s important to understand that not chasing does not imply initiating a trade in the opposite direction — discipline over impulse.
Be sure to review the ES Weekly Plan | July 7-11, 2025 for a broader perspective, key levels, and market expectations for the week ahead.
Contextual Analysis & Plan
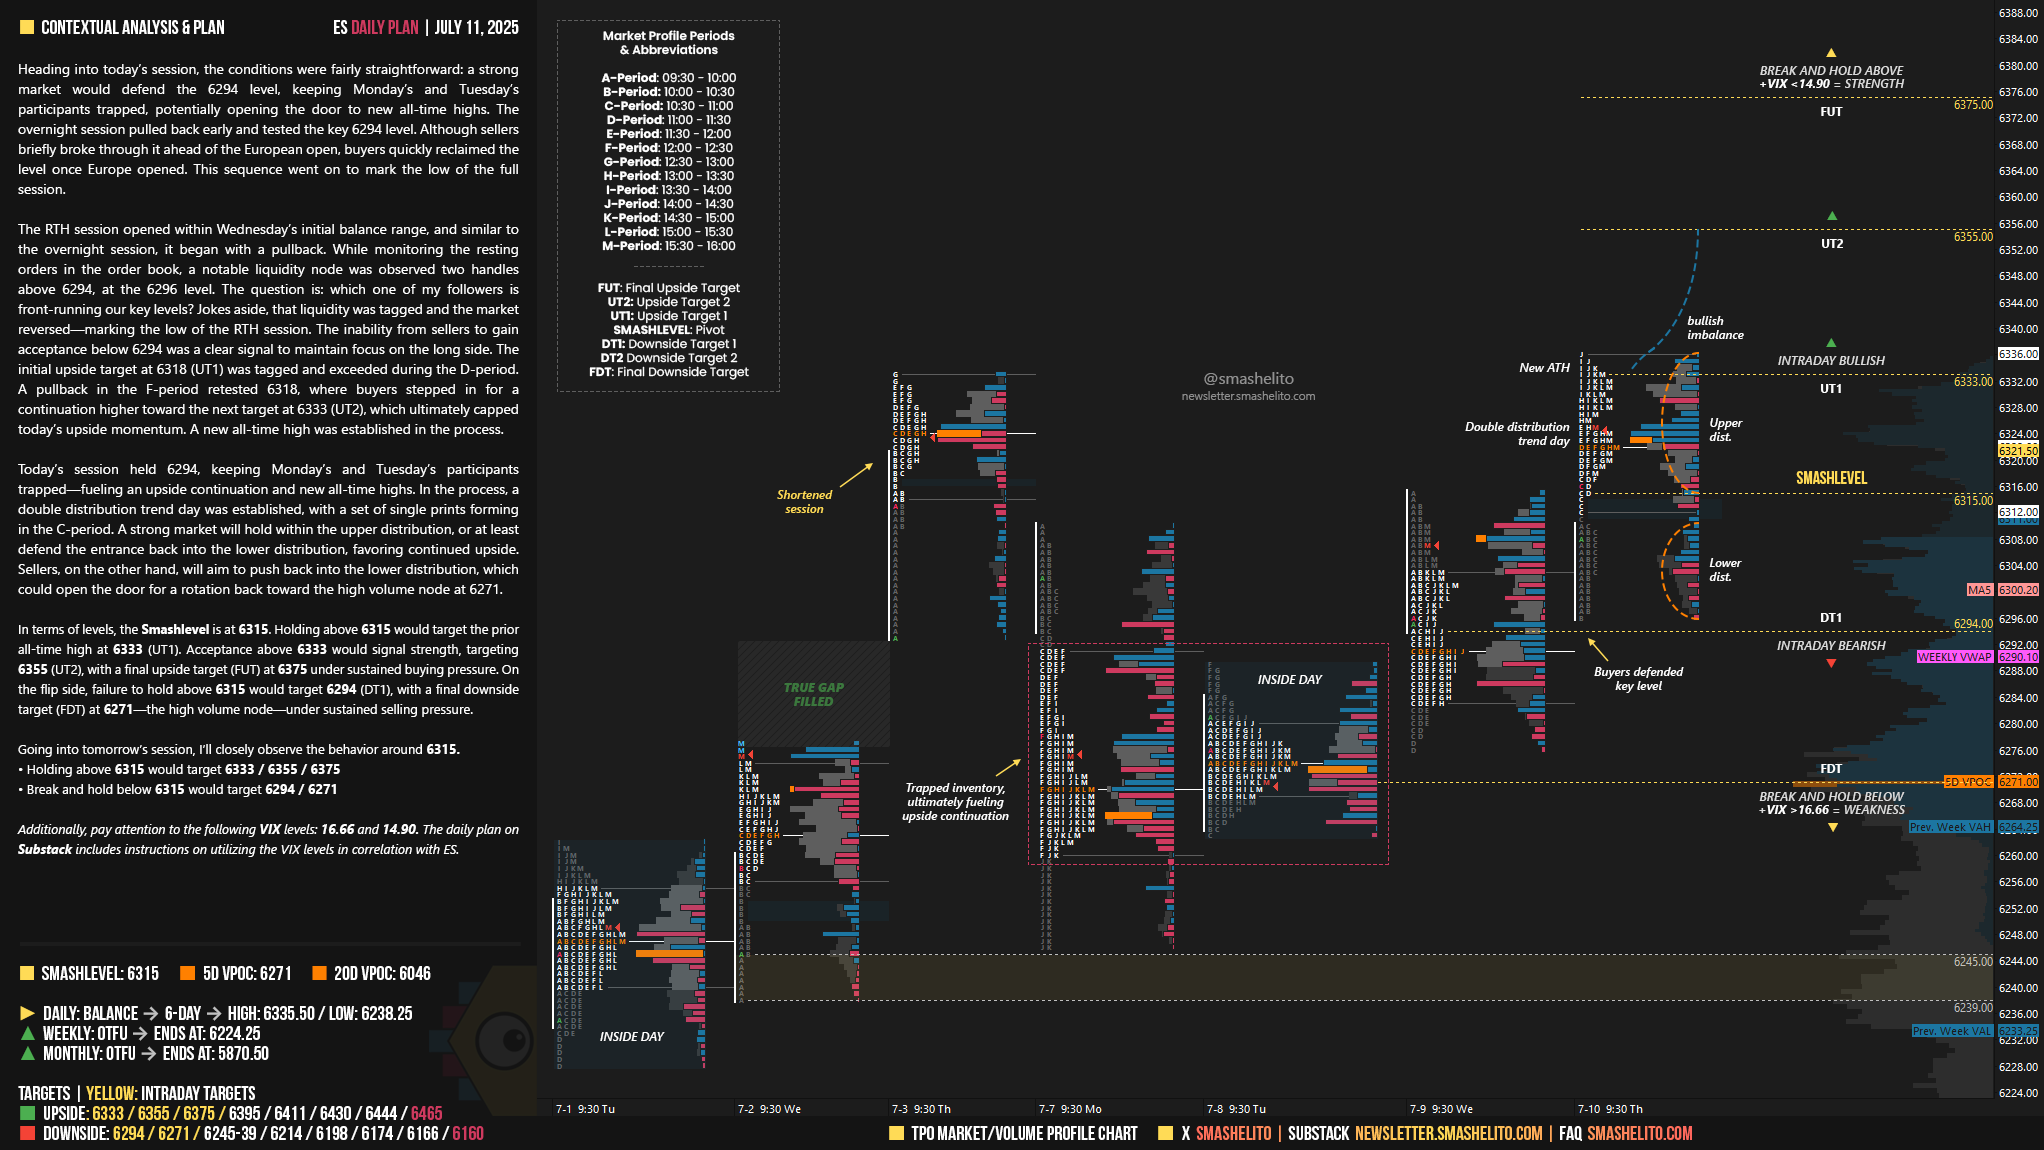
Heading into today’s session, the conditions were fairly straightforward: a strong market would defend the 6294 level, keeping Monday’s and Tuesday’s participants trapped, potentially opening the door to new all-time highs. The overnight session pulled back early and tested the key 6294 level. Although sellers briefly broke through it ahead of the European open, buyers quickly reclaimed the level once Europe opened. This sequence went on to mark the low of the full session.
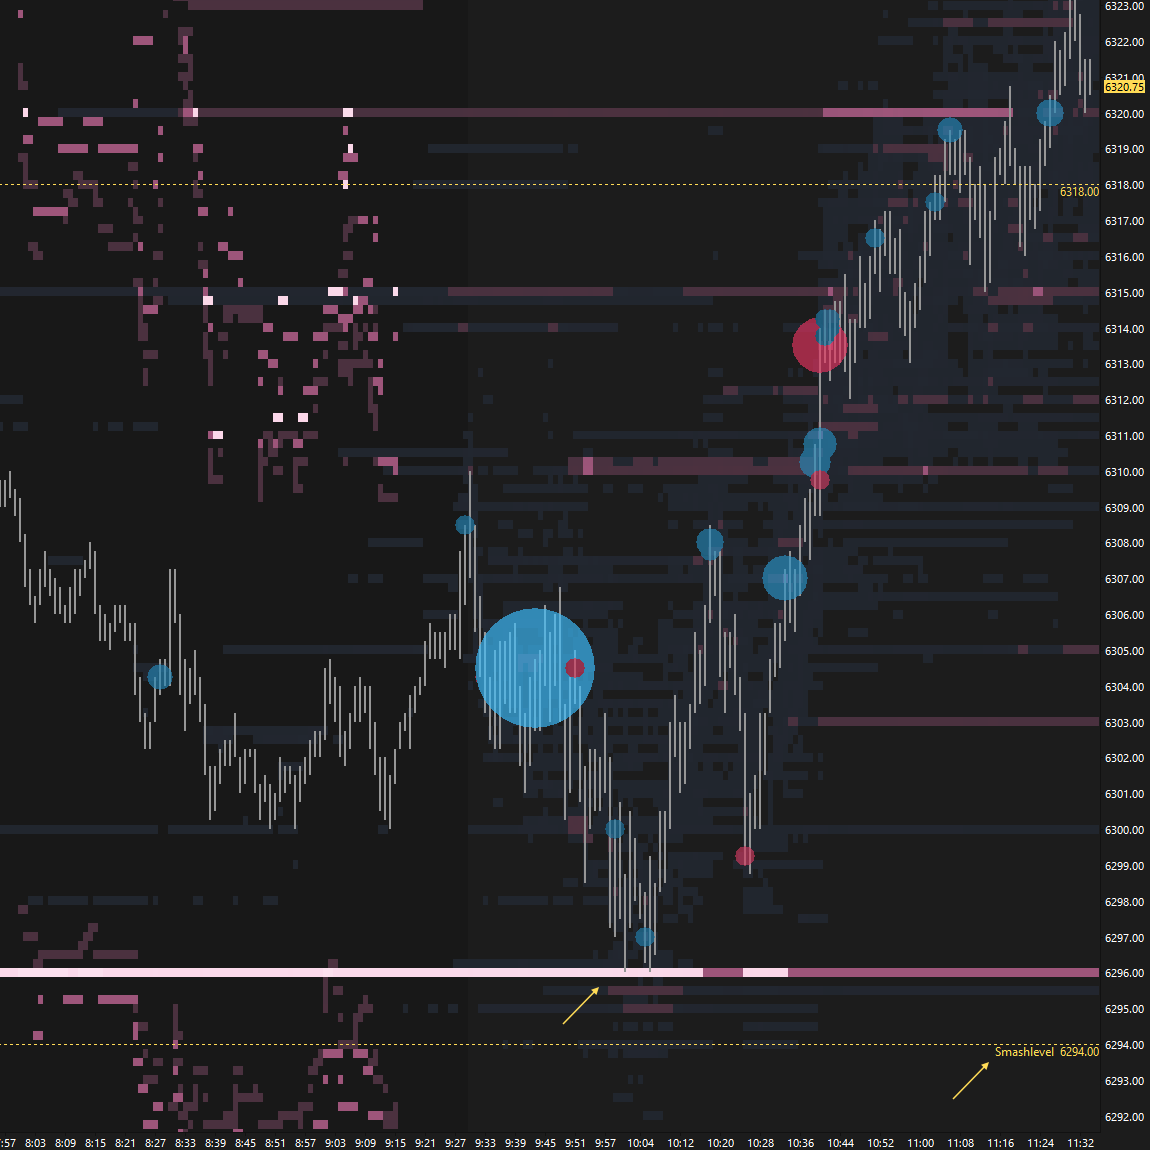
The RTH session opened within Wednesday’s initial balance range, and similar to the overnight session, it began with a pullback. While monitoring the resting orders in the order book, a notable liquidity node was observed two handles above 6294, at the 6296 level (see Figure 1). The question is: which one of my followers is front-running our key levels? Jokes aside, that liquidity was tagged and the market reversed—marking the low of the RTH session. The inability from sellers to gain acceptance below 6294 was a clear signal to maintain focus on the long side. The initial upside target at 6318 (UT1) was tagged and exceeded during the D-period. A pullback in the F-period retested 6318, where buyers stepped in for a continuation higher toward the next target at 6333 (UT2), which ultimately capped today’s upside momentum. A new all-time high was established in the process.
Today’s session held 6294, keeping Monday’s and Tuesday’s participants trapped—fueling an upside continuation and new all-time highs. In the process, a double distribution trend day was established, with a set of single prints forming in the C-period.
A strong market will hold within the upper distribution, or at least defend the entrance back into the lower distribution, favoring continued upside. Sellers, on the other hand, will aim to push back into the lower distribution, which could open the door for a rotation back toward the high volume node at 6271.
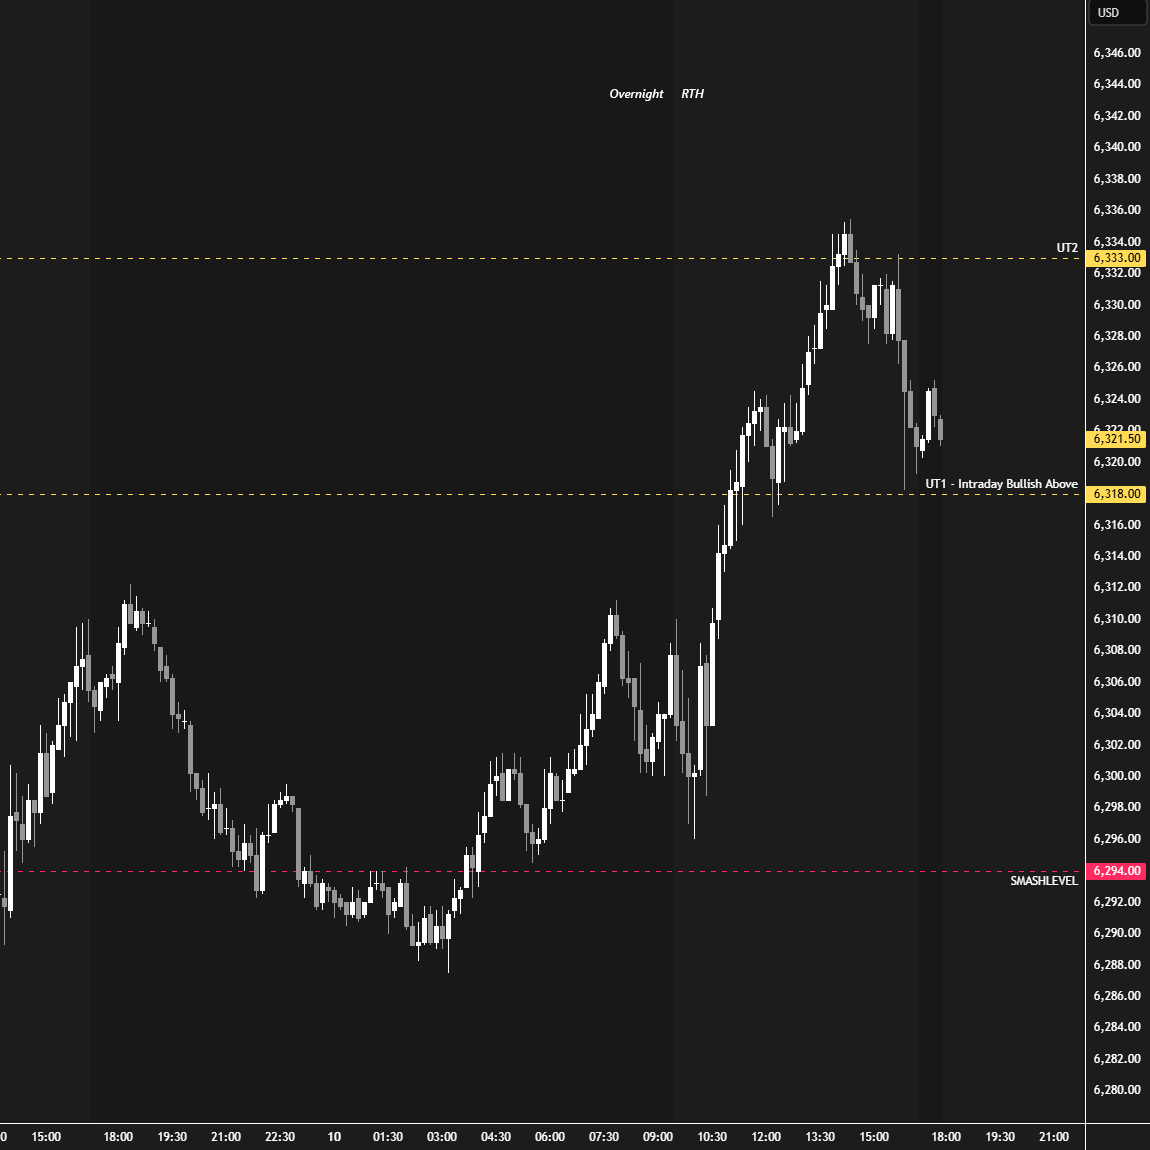
In terms of levels, the Smashlevel is at 6315. Holding above 6315 would target the prior all-time high at 6333 (UT1). Acceptance above 6333 would signal strength, targeting 6355 (UT2), with a final upside target (FUT) at 6375 under sustained buying pressure.
On the flip side, failure to hold above 6315 would target 6294 (DT1), with a final downside target (FDT) at 6271—the high volume node—under sustained selling pressure.
Levels of Interest
Going into tomorrow’s session, I’ll closely observe the behavior around 6315.
Holding above 6315 would target 6333 / 6355 / 6375
Break and hold below 6315 would target 6294 / 6271
Additionally, pay attention to the following VIX levels: 16.66 and 14.90. These levels can provide confirmation of strength or weakness.
Break and hold above 6375 with VIX below 14.90 would confirm strength.
Break and hold below 6271 with VIX above 16.66 would confirm weakness.
Overall, it's important to exercise caution when trading outside of the highlighted yellow levels. A non-cooperative VIX may suggest possible reversals i.e trade setups.
These are some of the nicest charts I have seen someone make.
Enjoying the addition of how levels from prior plan worked