
ES Daily Plan | January 30, 2026
Market Context & Key Levels for the Day Ahead

— For new subscribers
The yellow levels highlighted at the bottom left of the chart are the primary intraday levels I focus on. To avoid impulsive decisions at poor trade locations, I follow a simple but effective rule: exercise caution when initiating trades outside of these yellow levels.
This means I’m cautious about chasing longs above the Final Upside Target (FUT) and shorts below the Final Downside Target (FDT). It’s important to understand that not chasing does not imply initiating a trade in the opposite direction — discipline over impulse.
Be sure to review the Weekly Plan for a broader perspective, key levels, and market expectations for the week ahead.

Contextual Analysis & Plan
The level with the potential to shift the short-term tone was 6994, as we’ve discussed. This is the December high, a level where buyers have struggled to gain meaningful traction above, often leading to liquidation breaks. Buyers successfully defended 6994 early in the overnight session, which triggered a solid reversal that led to a test of the Smashlevel at 7016. Acceptance above 7016 would have signaled strength, which is why it was very important to monitor the opening sequence of the RTH session, as the market opened one handle below at 7015.
The RTH session then looked above 7016 and failed, triggering a relatively quick test of 6994 once again. The change in tone occurred when the market breached 6994 with little to no responsive buying, which visibly triggered stops. The subsequent bounce immediately ran into sellers around ~6990, from where a vicious downside continuation unfolded. The VIX breached its resistance level at 17.26 even before 6994 was taken out, which was an early clue that potential weakness lay ahead. The Final Downside Target at 6952 (FDT) was tagged and exceeded during the Initial Balance, highlighting how emotional the price action was. As always, breaking the FDT with the VIX holding above its resistance is generally not a good condition to look for reversals. The market dropped another 50 handles, almost tagging the December value area high before buyers stepped in. A notable reversal unfolded off today’s lows, resulting in a close above last week’s high at 6969, which is a level to observe in the short term.
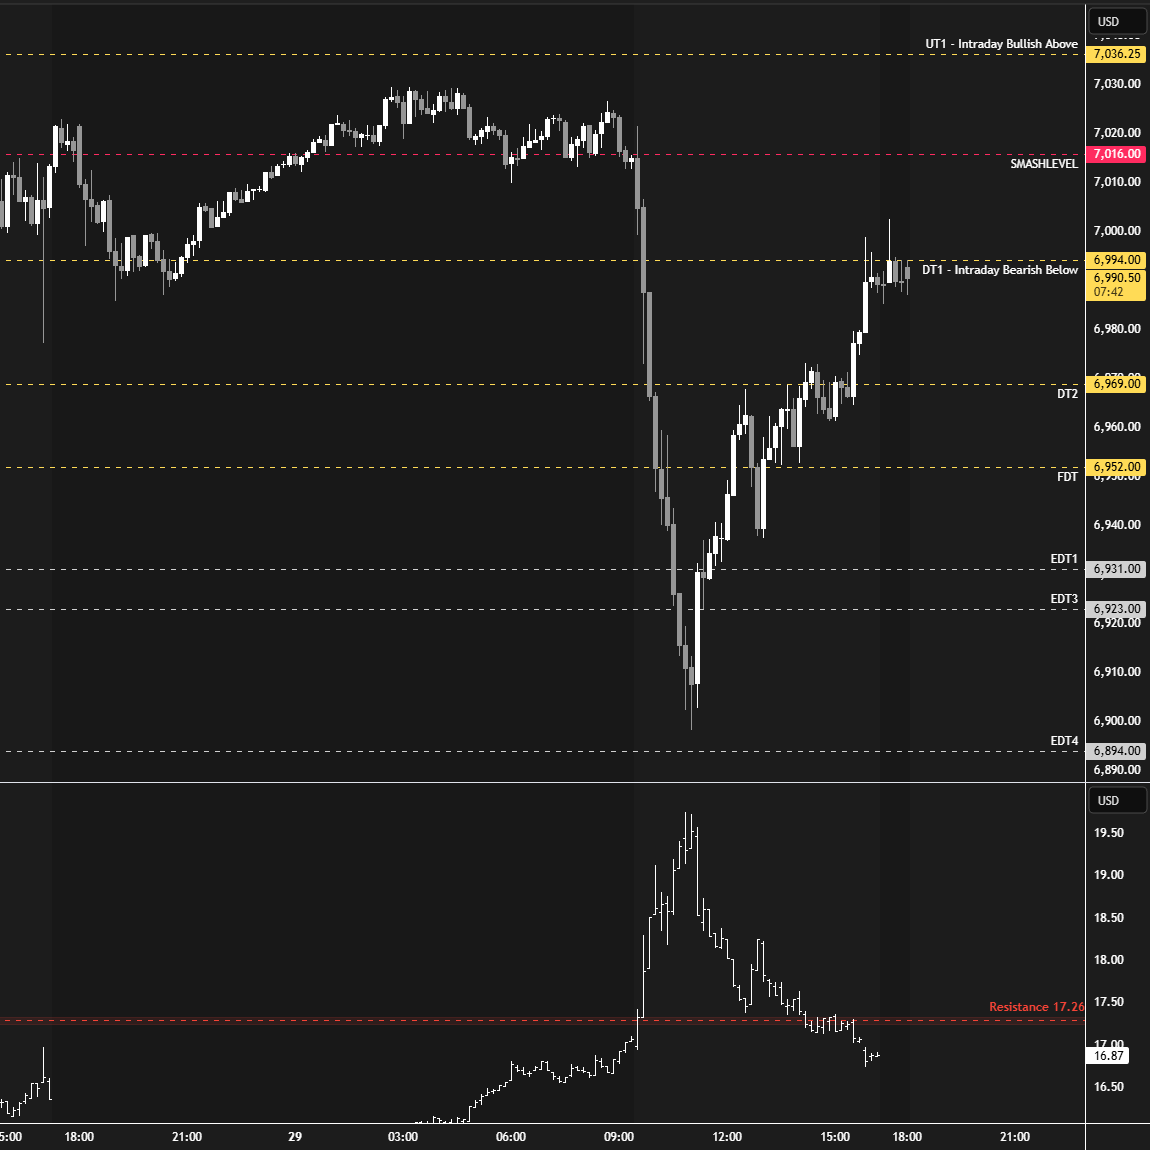
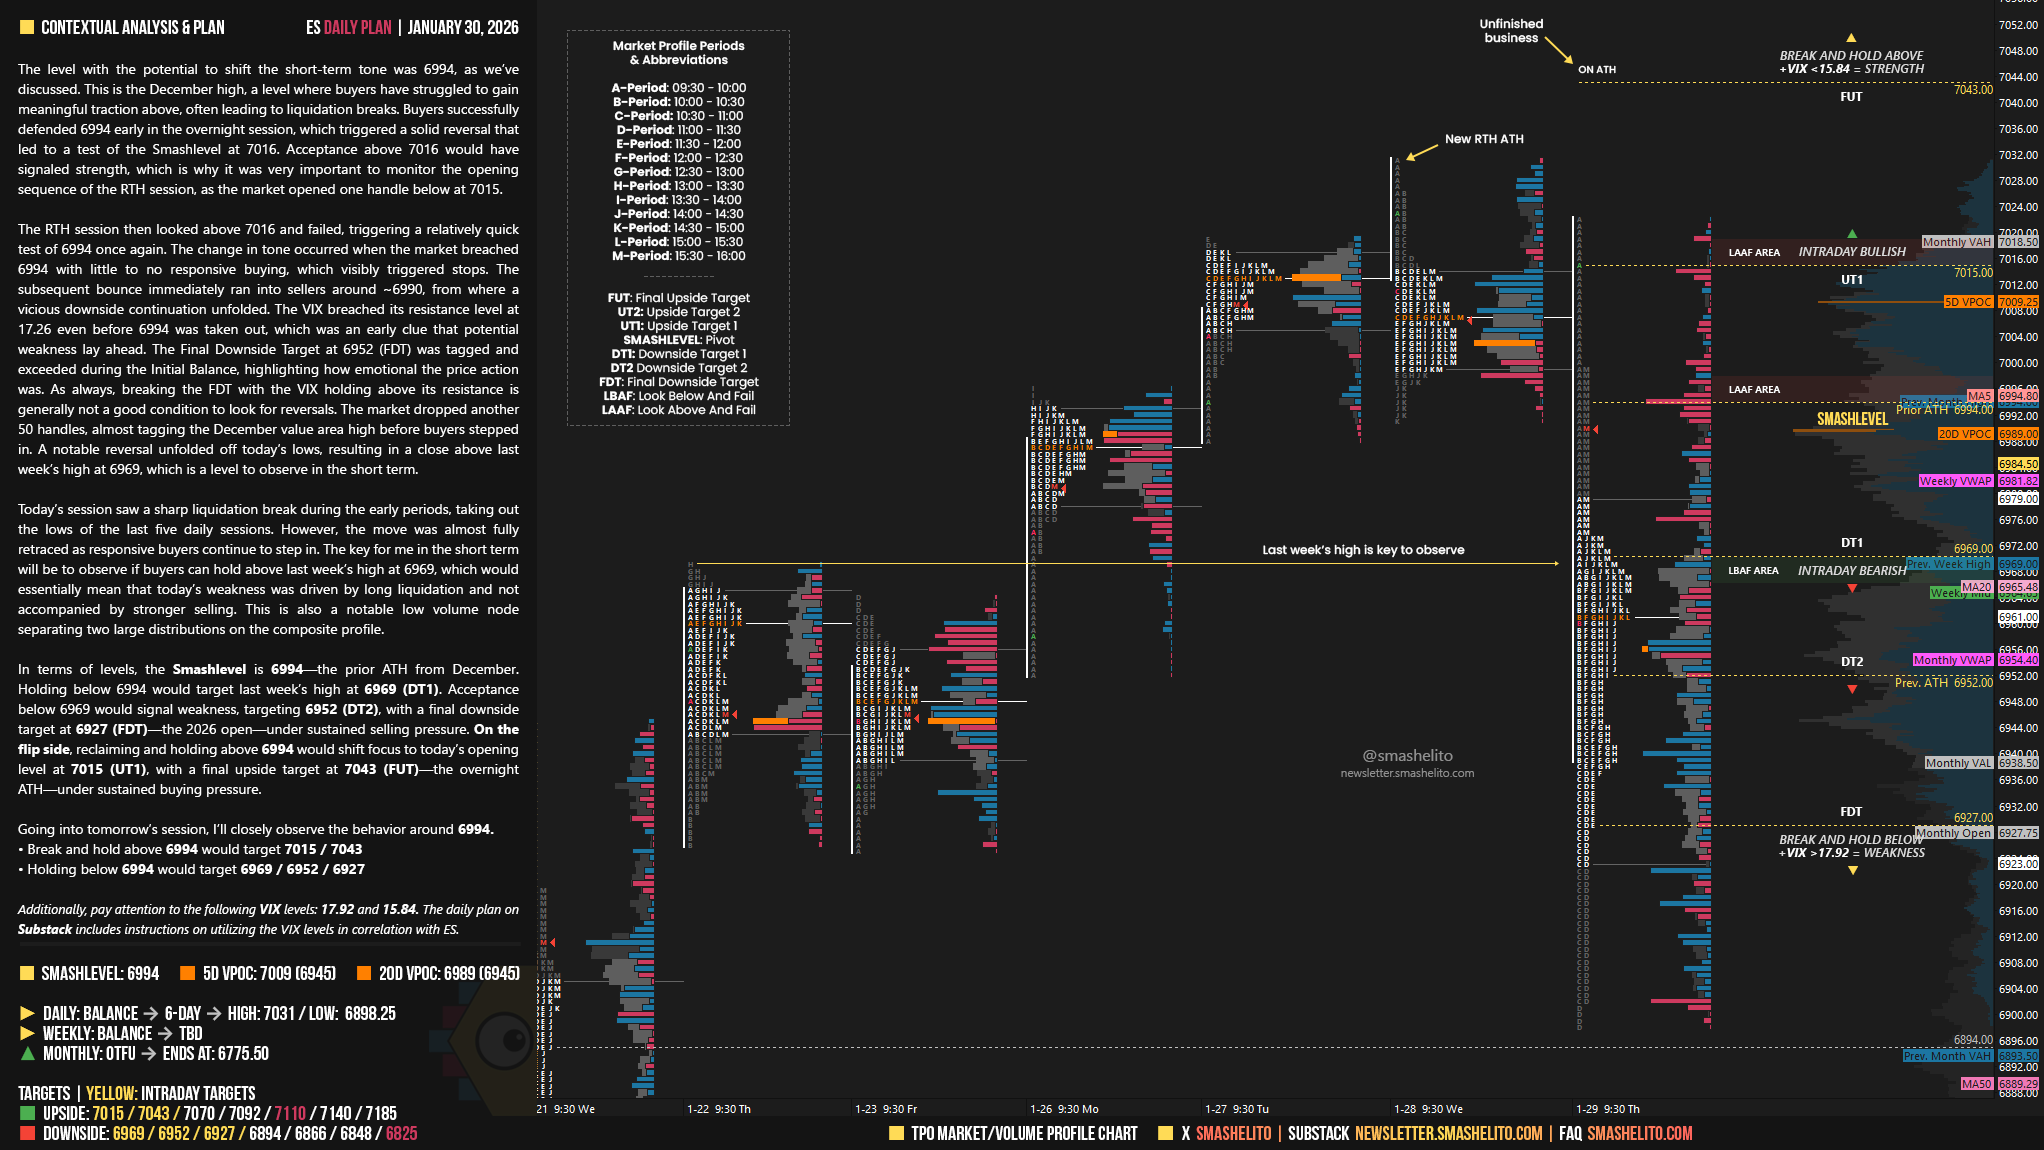
Today’s session saw a sharp liquidation break during the early periods, taking out the lows of the last five daily sessions. However, the move was almost fully retraced as responsive buyers continue to step in. The key for me in the short term will be to observe if buyers can hold above last week’s high at 6969, which would essentially mean that today’s weakness was driven by long liquidation and not accompanied by stronger selling. This is also a notable low volume node separating two large distributions on the composite profile.
In terms of levels, the Smashlevel is 6994—the prior ATH from December. Holding below 6994 would target last week’s high at 6969 (DT1). Acceptance below 6969 would signal weakness, targeting 6952 (DT2), with a final downside target at 6927 (FDT)—the 2026 open—under sustained selling pressure. On the flip side, reclaiming and holding above 6994 would shift focus to today’s opening level at 7015 (UT1), with a final upside target at 7043 (FUT)—the overnight ATH—under sustained buying pressure.
Levels of Interest
Going into tomorrow’s session, I’ll closely observe the behavior around 6994.
Break and hold above 6994 would target 7015 / 7043
Holding below 6994 would target 6969 / 6952 / 6927
Additionally, pay attention to the following VIX levels: 17.92 and 15.84. These levels can provide confirmation of strength or weakness.
Break and hold above 7043 with VIX below 15.84 would confirm strength.
Break and hold below 6927 with VIX above 17.92 would confirm weakness.
Overall, it's important to exercise caution when trading outside of the highlighted yellow levels. A non-cooperative VIX may suggest possible reversals i.e trade setups.
Smash, we're in a period of very emotional trading sessions. I started in this world at the end of 2021 and hadn't experienced a market like this before. I understand that 2020 was similar, however, this is the first time I've navigated such emotional conditions, something I deeply appreciate. The truth is that your education, your support with each daily plan, the VIX teaching—absolutely everything—has been invaluable to me. I thank you from the bottom of my heart.
Before making money in the markets, you have to maintain it, and that, for me, is a huge achievement. I haven't had extraordinary gains, but even more importantly, I haven't had extraordinary losses. I'm learning to navigate these conditions, and without a doubt, a fundamental part of that is thanks to you being such a great mentor. God bless you and allow you to continue sharing this wisdom.
Thanks GOAT!