ES Daily Plan | January 30, 2024
Today’s session witnessed a breakout from the short-term balance area, effectively resolving the non-excess and printing a new all-time high in the process, which is also characterized as poor.
Visual Representation
For new followers, the yellow levels highlighted at the bottom are the primary levels that I focus on intraday. My strategy for preventing impulsive decisions at unfavorable locations involves following a simple yet effective rule of exercising caution when initiating trades outside of the yellow levels. This implies that I am cautious chasing longs above the final yellow upside target and shorts below the final yellow downside target. It is crucial to understand that refraining from chasing a trade is not an automatic invitation to initiate a trade in the opposite direction.
Contextual Analysis
The overnight session witnessed an immediate drop, which was promptly met by buyers at our initial downside level of 4900 (ONL: 4901.75). As we briefly discussed in the previous plan, the market possibly needed a breakdown before any potential rally. While this drop didn't meet the expected magnitude, it seems buyers were willing to act without a more substantial decrease. For the remainder of the overnight session, the market slowly moved higher back to Friday’s value.
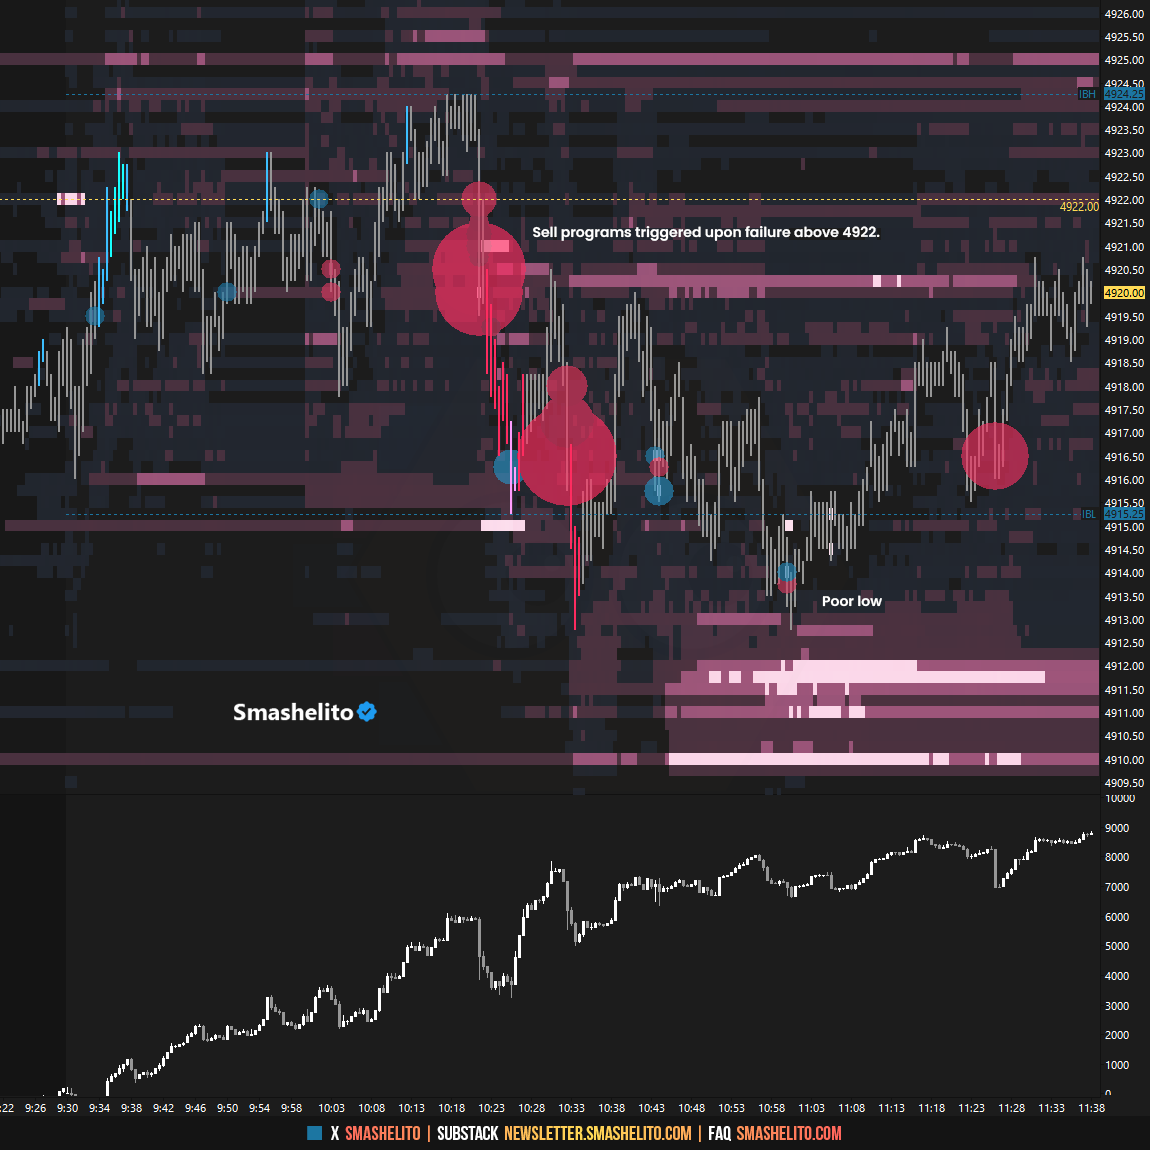
The RTH session was essentially a snoozer until it exploded later in the session. The initial balance, referring to the A and B-periods which represent the first hour of the RTH, was only 9 handles wide, emphasizing its uneventful nature. The Smashlevel of 4922 was tested a couple of times during the initial balance; however, every attempt was rejected and met by a sell program during the B-period. As previously discussed, there were buyers trapped within that area from Friday, potentially contributing to the selling pressure as they exited their positions. Sellers attempted a range extension to the downside following a break of the initial balance low in C-period. This attempt failed hard, resulting in the formation of a poor low in C/D-period. This piece of information, coupled with the lack of downside pace, prompted me to cut my shorts, which I thought had significant potential when initiated on the failure above 4922. The market continued to battle around the 4922 level in the PM session, and eventually buyers started gaining traction above after yet another poor low in the G/H-period. Our final upside target for today was 4960, with the high of the day reaching 4956 in the closing session.
Today’s session witnessed a breakout from the short-term balance area, effectively resolving the non-excess and printing a new all-time high in the process, which is also characterized as poor. In the short-term, my focus will be on the lower end of today’s upper distribution, at 4945. The most bullish outcome would involve holding and consolidation above it, while the most bearish outcome would involve filling the poor structure and returning back within the balance area, signaling a failed breakout. Caution with shorts until that occurs, as pullbacks into the poor structure are potentially technical fills before proceeding higher.
For tomorrow, the Smashlevel (Pivot) is 4945, representing the lower end of today’s upper distribution. Holding above 4945, indicating no interest in filling the breakout structure, would target the 100% range expansion level at 4960, as well as 4975, the lower end of the weekly resistance area. Acceptance above 4975 would target the Monthly Extreme High of 4993. Break and hold below 4945 would target the breakout single prints at 4933, coinciding with the Weekly VWAP. Break and hold below 4933 would target the high volume node (HVN) at 4917, acting as a downside magnet in the event of a failed breakout.
Levels of Interest
Going into tomorrow's session, I will observe 4945.
Holding above 4945 would target 4960 / 4975 / 4993
Break and hold below 4945 would target 4933 / 4917
Additionally, pay attention to the following VIX levels: 14.26 and 12.94. These levels can provide confirmation of strength or weakness.
Break and hold above 4993 with VIX below 12.94 would confirm strength.
Break and hold below 4917 with VIX above 14.26 would confirm weakness.
Overall, it's important to exercise caution when trading outside of the highlighted yellow levels. A non-cooperative VIX may suggest possible reversals i.e trade setups.
Weekly Plan
Be sure to check out the Weekly Plan, which provides a broader perspective and highlights significant levels of interest to watch in the coming week.
Disclaimer: Futures and options trading involves a high level of risk, with the potential for substantial losses. The information provided in this newsletter is for informational purposes only and is not intended to be a trade recommendation. It is the responsibility of the reader to make their own investment decisions and they should seek the advice of a qualified securities professional before making any investments. The owners/authors of this newsletter are not certified as registered financial professionals or investment advisers.


Levels on point
Great action today. What was with the $VIX this morning. Through 15 and back. Was that a glitch. About same time /es was closing in on first hour