
ES Daily Plan | January 28, 2026
Market Context & Key Levels for the Day Ahead

— For new subscribers
The yellow levels highlighted at the bottom left of the chart are the primary intraday levels I focus on. To avoid impulsive decisions at poor trade locations, I follow a simple but effective rule: exercise caution when initiating trades outside of these yellow levels.
This means I’m cautious about chasing longs above the Final Upside Target (FUT) and shorts below the Final Downside Target (FDT). It’s important to understand that not chasing does not imply initiating a trade in the opposite direction — discipline over impulse.
Be sure to review the Weekly Plan for a broader perspective, key levels, and market expectations for the week ahead.

Contextual Analysis & Plan
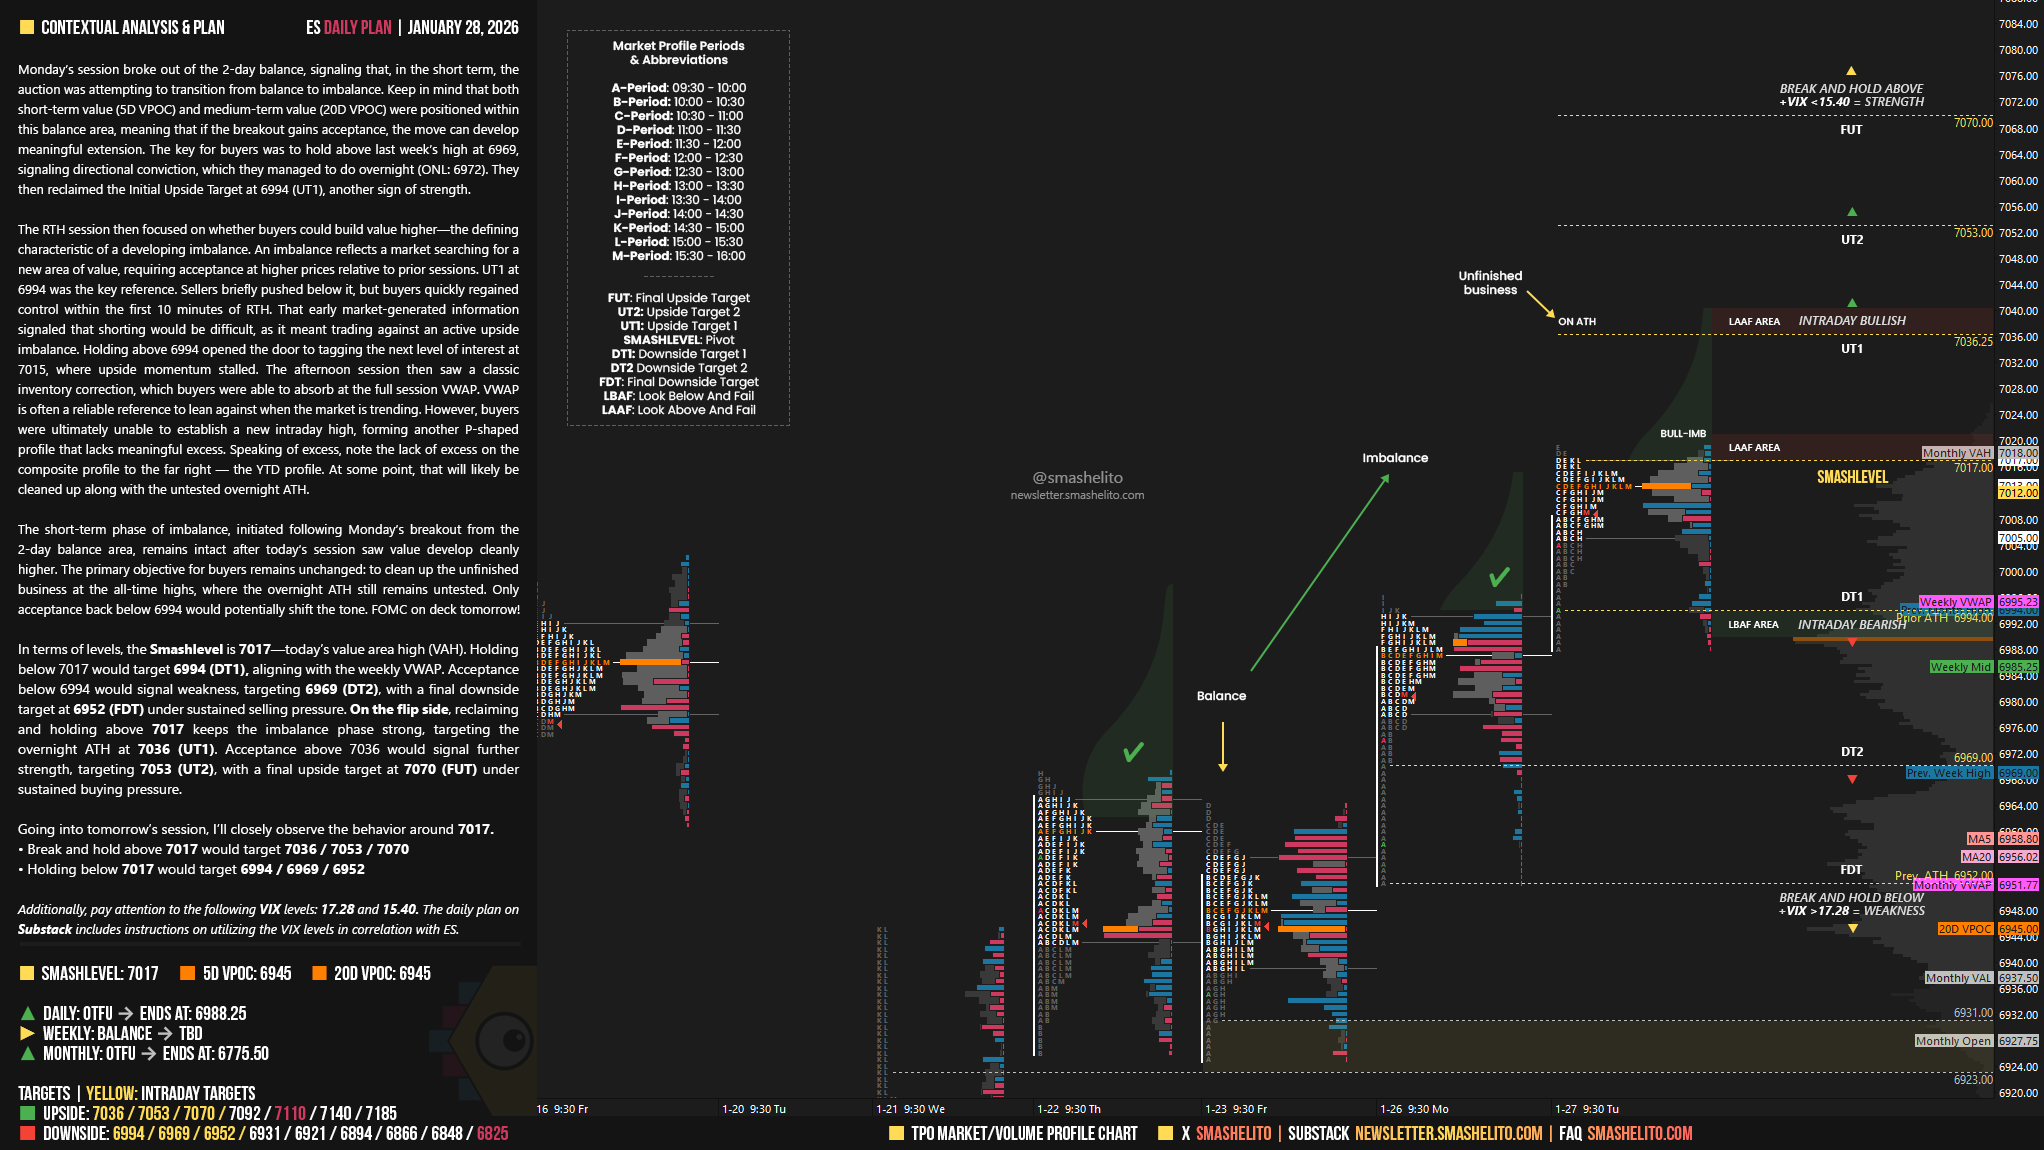
Monday’s session broke out of the 2-day balance, signaling that, in the short term, the auction was attempting to transition from balance to imbalance. Keep in mind that both short-term value (5D VPOC) and medium-term value (20D VPOC) were positioned within this balance area, meaning that if the breakout gains acceptance, the move can develop meaningful extension. The key for buyers was to hold above last week’s high at 6969, signaling directional conviction, which they managed to do overnight (ONL: 6972). They then reclaimed the Initial Upside Target at 6994 (UT1), another sign of strength.
The RTH session then focused on whether buyers could build value higher—the defining characteristic of a developing imbalance. An imbalance reflects a market searching for a new area of value, requiring acceptance at higher prices relative to prior sessions. UT1 at 6994 was the key reference. Sellers briefly pushed below it, but buyers quickly regained control within the first 10 minutes of RTH. That early market-generated information signaled that shorting would be difficult, as it meant trading against an active upside imbalance.
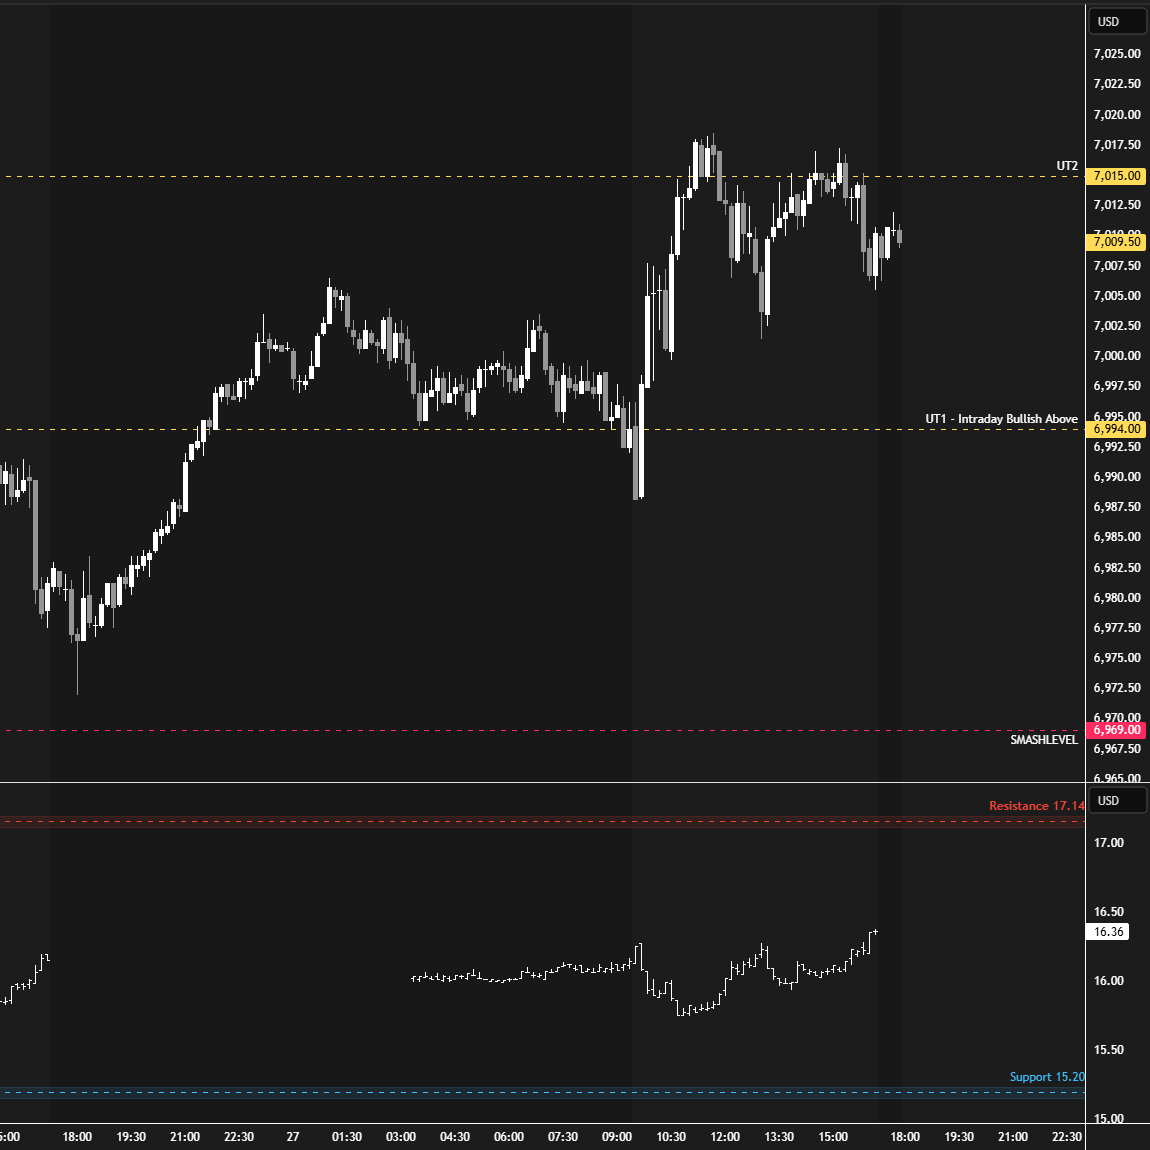
Holding above 6994 opened the door to tagging the next level of interest at 7015, where upside momentum stalled. The afternoon session then saw a classic inventory correction, which buyers were able to absorb at the full session VWAP. VWAP is often a reliable reference to lean against when the market is trending.
However, buyers were ultimately unable to establish a new intraday high, forming another P-shaped profile that lacks meaningful excess. Speaking of excess, note the lack of excess on the composite profile to the far right — the YTD profile. At some point, that will likely be cleaned up along with the untested overnight ATH.
The short-term phase of imbalance, initiated following Monday’s breakout from the 2-day balance area, remains intact after today’s session saw value develop cleanly higher. The primary objective for buyers remains unchanged: to clean up the unfinished business at the all-time highs, where the overnight ATH still remains untested. Only acceptance back below 6994 would potentially shift the tone. FOMC on deck tomorrow!
In terms of levels, the Smashlevel is 7017—today’s value area high (VAH). Holding below 7017 would target 6994 (DT1), aligning with the weekly VWAP. Acceptance below 6994 would signal weakness, targeting 6969 (DT2), with a final downside target at 6952 (FDT) under sustained selling pressure.
On the flip side, reclaiming and holding above 7017 keeps the imbalance phase strong, targeting the overnight ATH at 7036 (UT1). Acceptance above 7036 would signal further strength, targeting 7053 (UT2), with a final upside target at 7070 (FUT) under sustained buying pressure.
Levels of Interest
Going into tomorrow’s session, I’ll closely observe the behavior around 7017.
Break and hold above 7017 would target 7036 / 7053 / 7070
Holding below 7017 would target 6994 / 6969 / 6952
Additionally, pay attention to the following VIX levels: 17.28 and 15.40. These levels can provide confirmation of strength or weakness.
Break and hold above 7070 with VIX below 15.40 would confirm strength.
Break and hold below 6952 with VIX above 17.28 would confirm weakness.
Overall, it's important to exercise caution when trading outside of the highlighted yellow levels. A non-cooperative VIX may suggest possible reversals i.e trade setups.
1.<<meaning that if the breakout gains acceptance, the move can develop meaningful extension.>>
2. <<An imbalance reflects a market searching for a new area of value, requiring acceptance at higher prices relative to prior sessions.>>
3. << but buyers quickly regained control within the first 10 minutes of RTH. That early market-generated information signaled that shorting would be difficult, as it meant trading against an active upside imbalance.>>
4.<<which buyers were able to absorb at the full session VWAP. VWAP is often a reliable reference to lean against when the market is trending.>>
5.<< note the lack of excess on the composite profile to the far right — the YTD profile. At some point, that will likely be cleaned up along with the untested overnight ATH >>
Con sincero aprecio, Smashelito,
I selected these excerpts because each line is exceptionally clear and educational. Your commentary distills the core principles taught by Steidlmayer and Dalton, and the accompanying charts make the concepts immediately visible and practical. For me, it’s a real live lesson in market structure and contextual trading. Thank you for the value you provide.
I also hope that one day we might see a permanent appendix or a dedicated PDF compiling the full set of AMT case studies and their interpretations — available exclusively to paying subscribers. It would be an invaluable reference. Gracias, de corazón !
There's no other newsletter like this one. I've been through many, searching for education and learning from them all, but nothing compares to this. What Loannis says is true; all this education, accompanied by visual aids, is unparalleled. I don't know if Smashelito is one person or several, but I hope life allows me to meet him someday, thank him, and above all, learn a lot from him, just as I'm doing now with this great newsletter.