
ES Daily Plan | January 27, 2026
Market Context & Key Levels for the Day Ahead

— For new subscribers
The yellow levels highlighted at the bottom left of the chart are the primary intraday levels I focus on. To avoid impulsive decisions at poor trade locations, I follow a simple but effective rule: exercise caution when initiating trades outside of these yellow levels.
This means I’m cautious about chasing longs above the Final Upside Target (FUT) and shorts below the Final Downside Target (FDT). It’s important to understand that not chasing does not imply initiating a trade in the opposite direction — discipline over impulse.
Be sure to review the Weekly Plan for a broader perspective, key levels, and market expectations for the week ahead.

Contextual Analysis & Plan
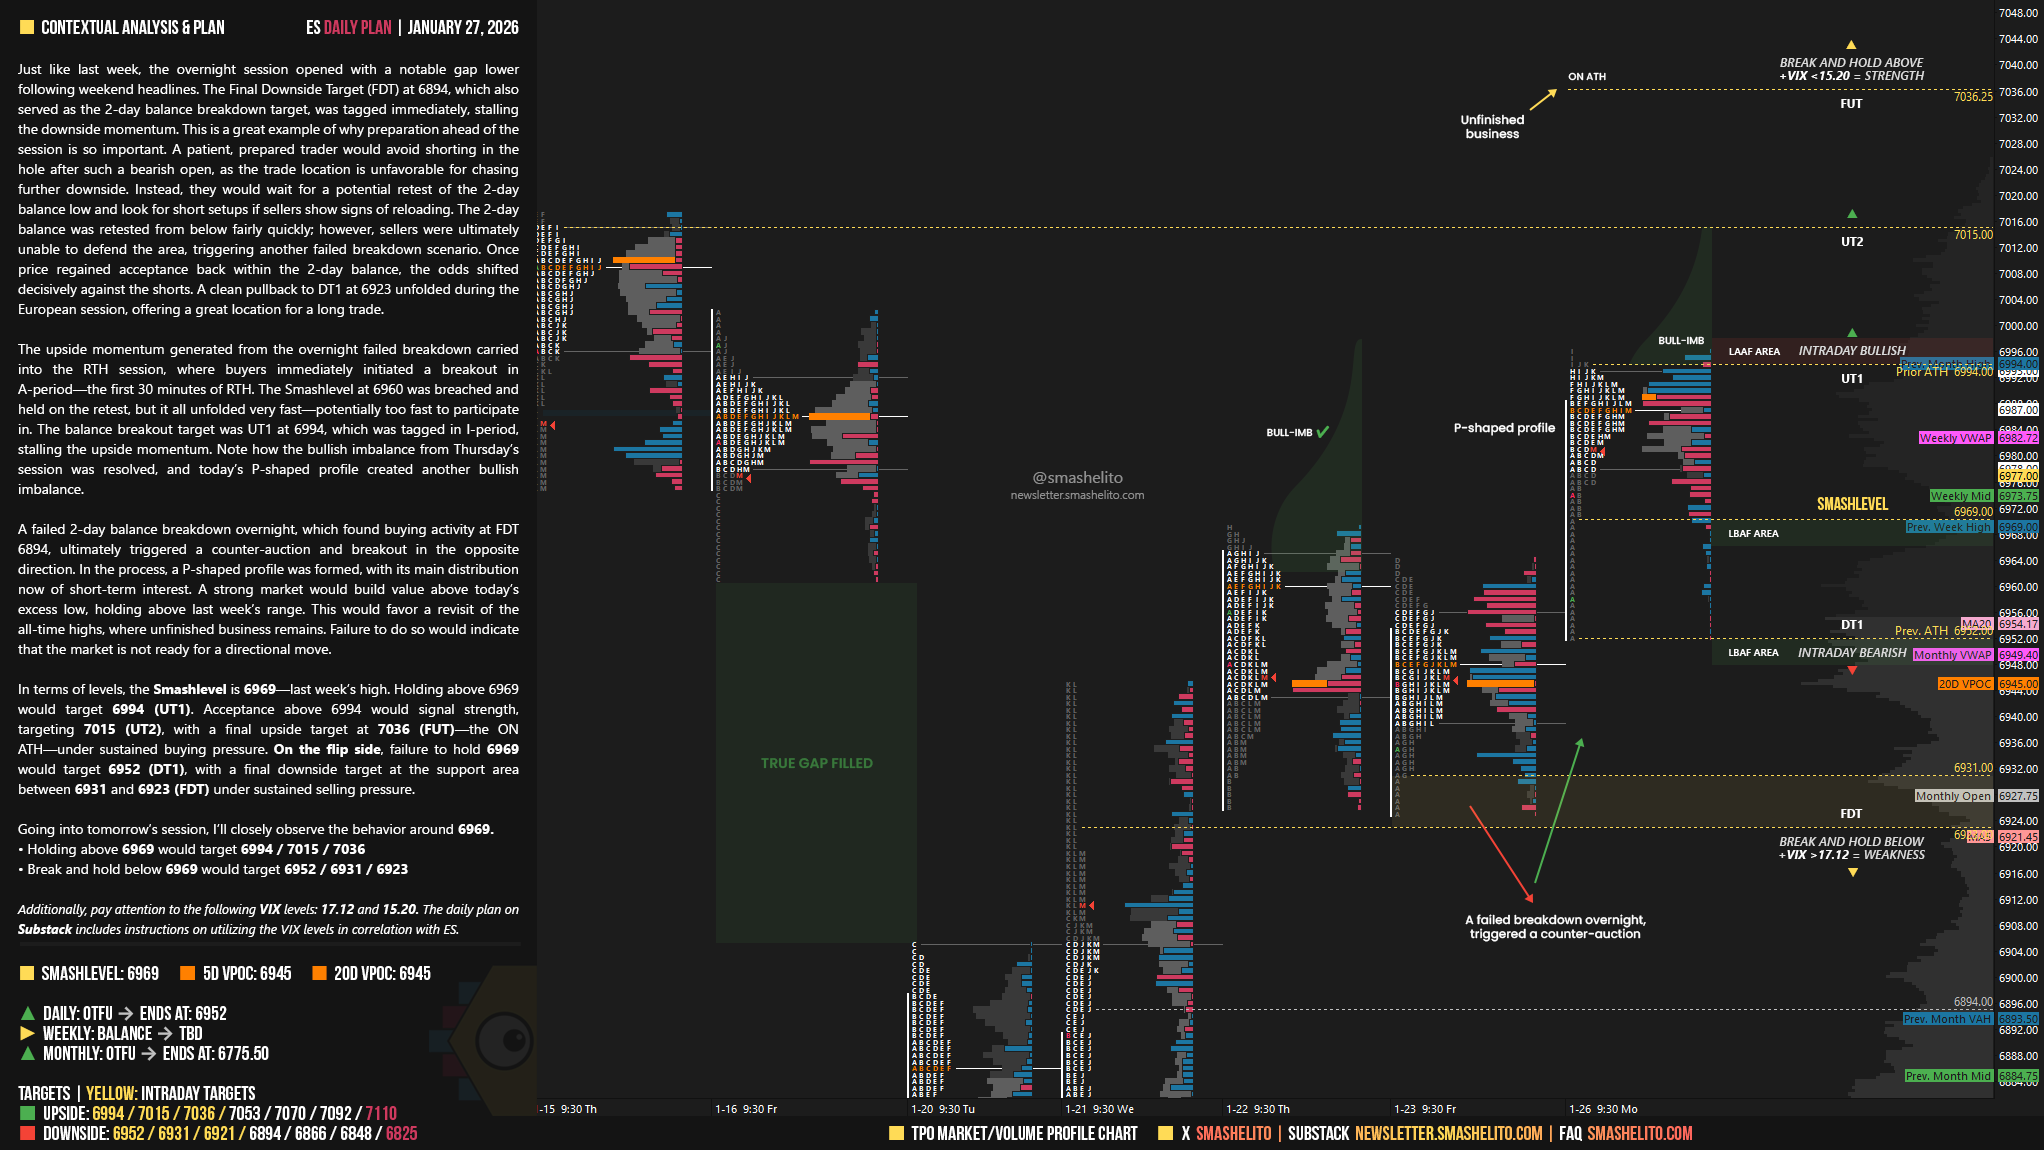
Just like last week, the overnight session opened with a notable gap lower following weekend headlines. The Final Downside Target (FDT) at 6894, which also served as the 2-day balance breakdown target, was tagged immediately, stalling the downside momentum.
This is a great example of why preparation ahead of the session is so important. A patient, prepared trader would avoid shorting in the hole after such a bearish open, as the trade location is unfavorable for chasing further downside. Instead, they would wait for a potential retest of the 2-day balance low and look for short setups if sellers show signs of reloading.
The 2-day balance was retested from below fairly quickly; however, sellers were ultimately unable to defend the area, triggering another failed breakdown scenario. Once price regained acceptance back within the 2-day balance, the odds shifted decisively against the shorts. A clean pullback to DT1 at 6923 unfolded during the European session, offering a great location for a long trade.
The upside momentum generated from the overnight failed breakdown carried into the RTH session, where buyers immediately initiated a breakout in A-period—the first 30 minutes of RTH. The Smashlevel at 6960 was breached and held on the retest, but it all unfolded very fast—potentially too fast to participate in. The balance breakout target was UT1 at 6994, which was tagged in I-period, stalling the upside momentum. Note how the bullish imbalance from Thursday’s session was resolved, and today’s P-shaped profile created another bullish imbalance.
A failed 2-day balance breakdown overnight, which found buying activity at FDT 6894, ultimately triggered a counter-auction and breakout in the opposite direction. In the process, a P-shaped profile was formed, with its main distribution now of short-term interest.
A strong market would build value above today’s excess low, holding above last week’s range. This would favor a revisit of the all-time highs, where unfinished business remains. Failure to do so would indicate that the market is not ready for a directional move.
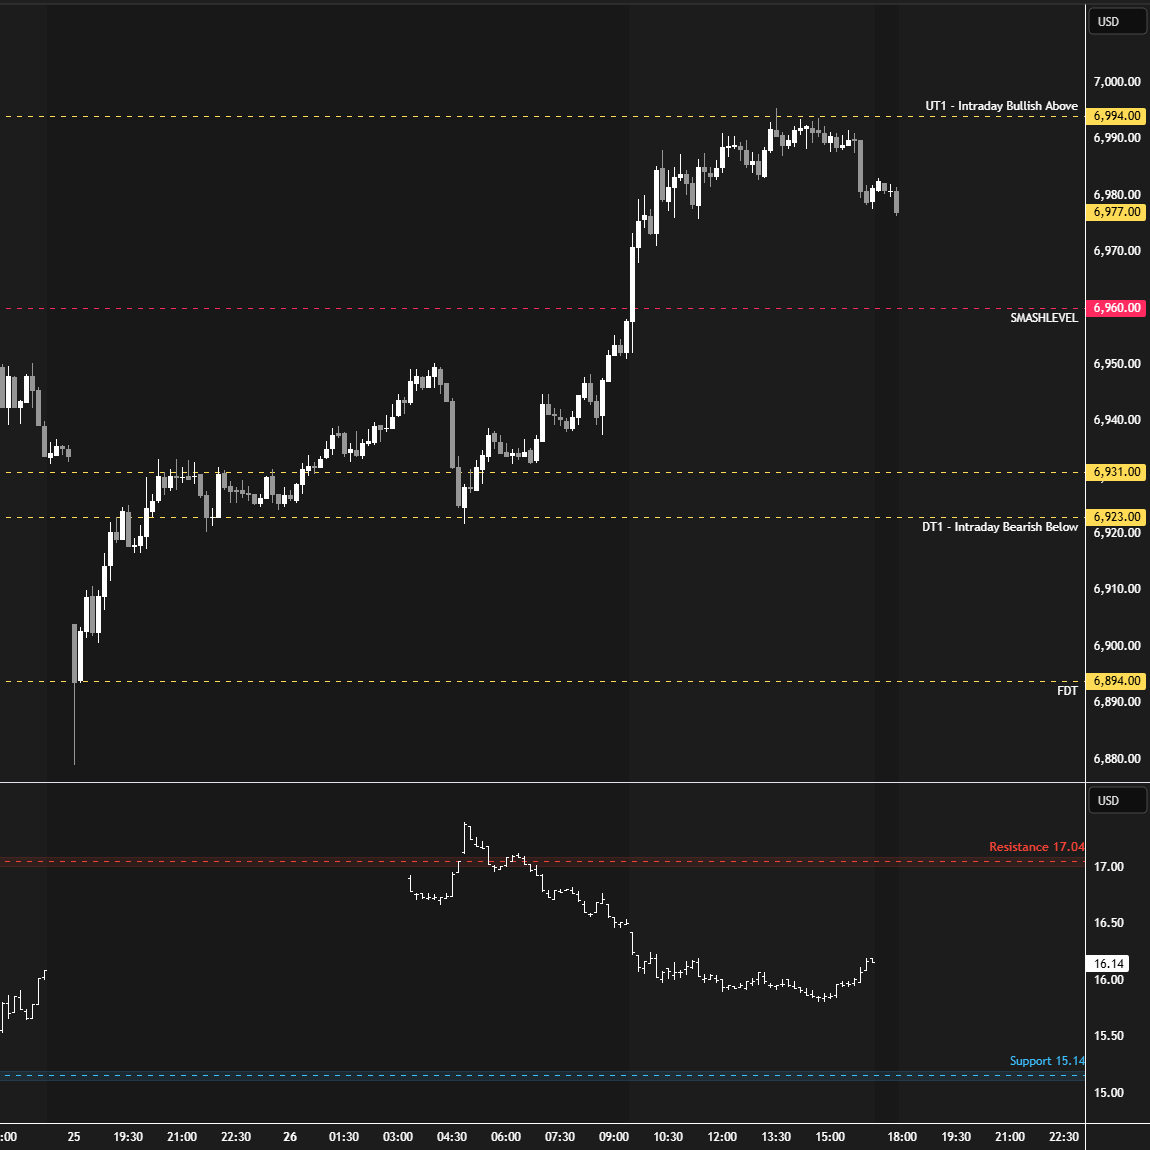
In terms of levels, the Smashlevel is 6969—last week’s high. Holding above 6969 would target 6994 (UT1). Acceptance above 6994 would signal strength, targeting 7015 (UT2), with a final upside target at 7036 (FUT)—the ON ATH—under sustained buying pressure.
On the flip side, failure to hold 6969 would target 6952 (DT1), with a final downside target at the support area between 6931 and 6923 (FDT) under sustained selling pressure.
Levels of Interest
Going into tomorrow’s session, I’ll closely observe the behavior around 6969.
Holding above 6969 would target 6994 / 7015 / 7036
Break and hold below 6969 would target 6952 / 6931 / 6923
Additionally, pay attention to the following VIX levels: 17.12 and 15.20. These levels can provide confirmation of strength or weakness.
Break and hold above 7036 with VIX below 15.20 would confirm strength.
Break and hold below 6923 with VIX above 17.12 would confirm weakness.
Overall, it's important to exercise caution when trading outside of the highlighted yellow levels. A non-cooperative VIX may suggest possible reversals i.e trade setups.
I will always be grateful for what you do, have a great session!
Thanks Smash!