
ES Daily Plan | January 26, 2026
Market Context & Key Levels for the Day Ahead

— For new subscribers
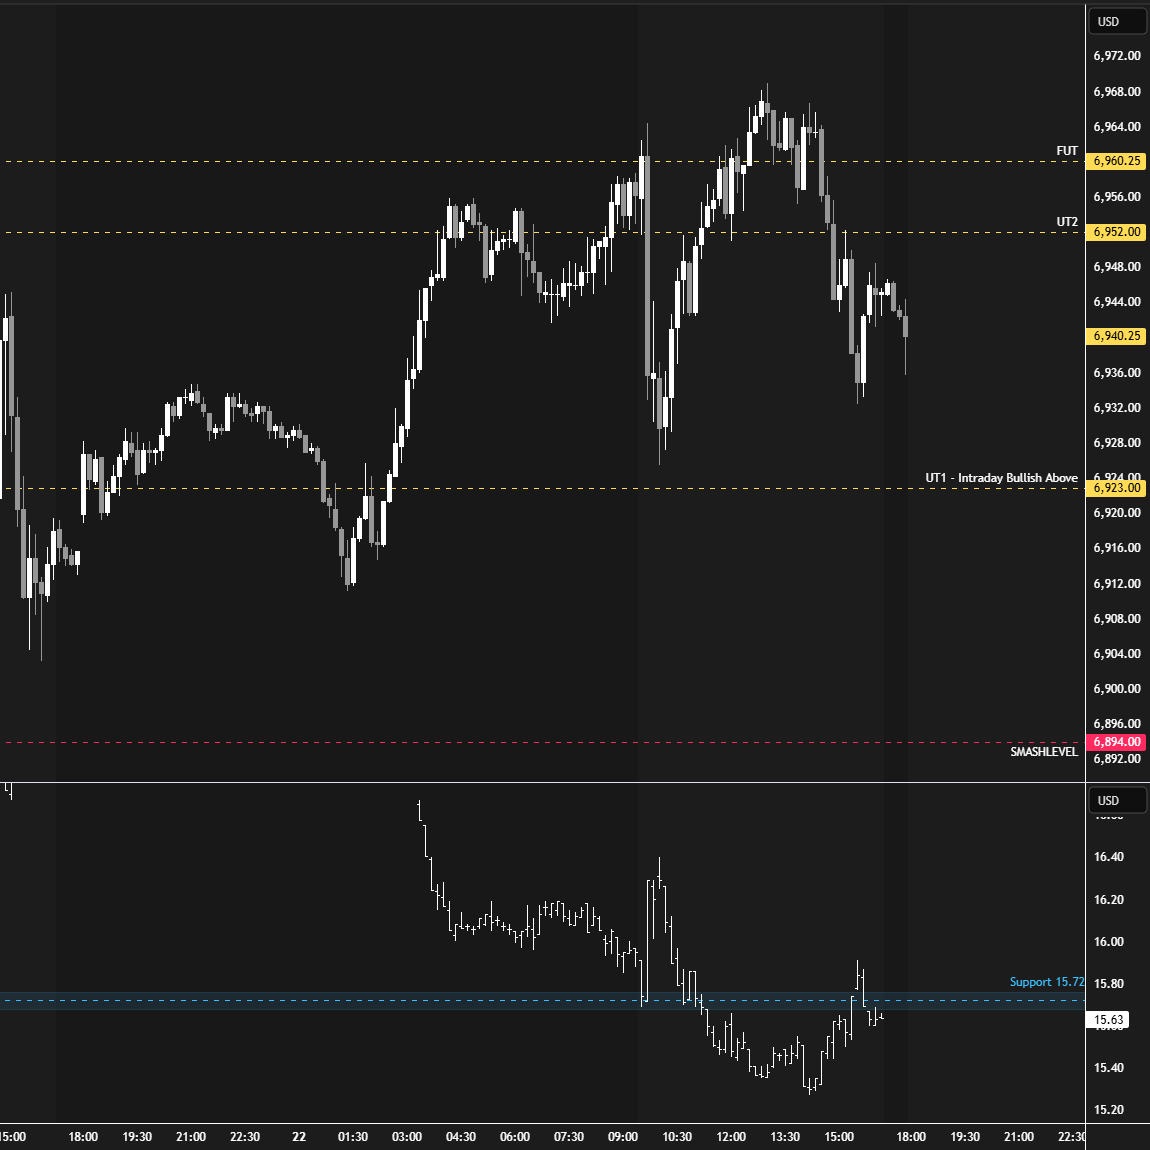
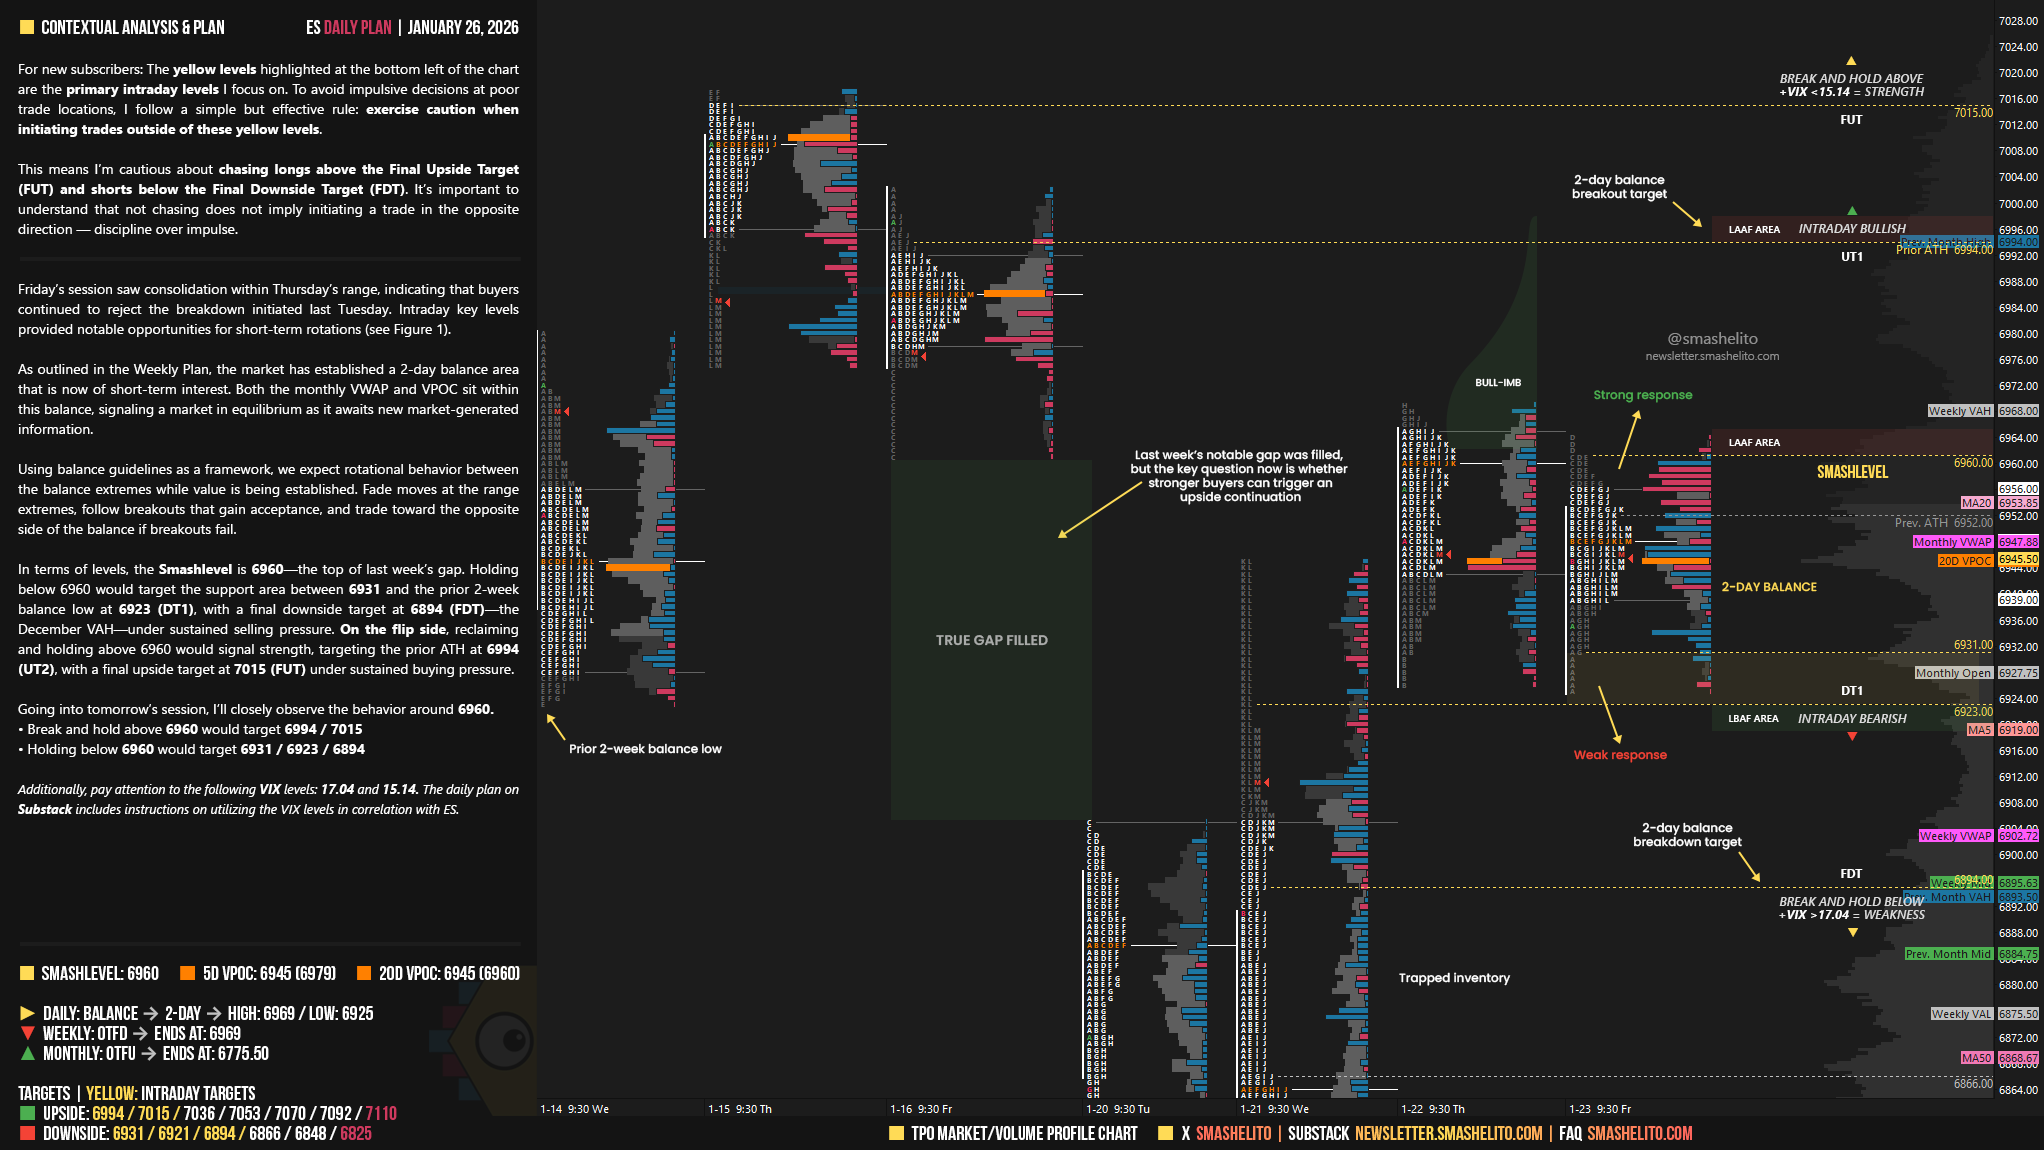
The yellow levels highlighted at the bottom left of the chart are the primary intraday levels I focus on. To avoid impulsive decisions at poor trade locations, I follow a simple but effective rule: exercise caution when initiating trades outside of these yellow levels.
This means I’m cautious about chasing longs above the Final Upside Target (FUT) and shorts below the Final Downside Target (FDT). It’s important to understand that not chasing does not imply initiating a trade in the opposite direction — discipline over impulse.
Be sure to review the Weekly Plan for a broader perspective, key levels, and market expectations for the week ahead.

Contextual Analysis & Plan
Friday’s session saw consolidation within Thursday’s range, indicating that buyers continued to reject the breakdown initiated last Tuesday. Intraday key levels provided notable opportunities for short-term rotations (see Figure 1).
As outlined in the Weekly Plan, the market has established a 2-day balance area that is now of short-term interest. Both the monthly VWAP and VPOC sit within this balance, signaling a market in equilibrium as it awaits new market-generated information.
Using balance guidelines as a framework, we expect rotational behavior between the balance extremes while value is being established. Fade moves at the range extremes, follow breakouts that gain acceptance, and trade toward the opposite side of the balance if breakouts fail.
In terms of levels, the Smashlevel is 6960—the top of last week’s gap. Holding below 6960 would target the support area between 6931 and the prior 2-week balance low at 6923 (DT1), with a final downside target at 6894 (FDT)—the December VAH—under sustained selling pressure.
On the flip side, reclaiming and holding above 6960 would signal strength, targeting the prior ATH at 6994 (UT2), with a final upside target at 7015 (FUT) under sustained buying pressure.
Levels of Interest
Going into tomorrow’s session, I’ll closely observe the behavior around 6960.
Break and hold above 6960 would target 6994 / 7015
Holding below 6960 would target 6931 / 6923 / 6894
Additionally, pay attention to the following VIX levels: 17.04 and 15.14. These levels can provide confirmation of strength or weakness.
Break and hold above 7015 with VIX below 15.14 would confirm strength.
Break and hold below 6894 with VIX above 17.04 would confirm weakness.
Overall, it's important to exercise caution when trading outside of the highlighted yellow levels. A non-cooperative VIX may suggest possible reversals i.e trade setups.
I want to make a contribution. I completed the entire process, but the payment hasn't been debited. I sent you an email explaining the situation. Thank you.
Thank you Smash!