
ES Daily Plan | January 13, 2026
Market Context & Key Levels for the Day Ahead

— For new subscribers
The yellow levels highlighted at the bottom left of the chart are the primary intraday levels I focus on. To avoid impulsive decisions at poor trade locations, I follow a simple but effective rule: exercise caution when initiating trades outside of these yellow levels.
This means I’m cautious about chasing longs above the Final Upside Target (FUT) and shorts below the Final Downside Target (FDT). It’s important to understand that not chasing does not imply initiating a trade in the opposite direction — discipline over impulse.
Be sure to review the Weekly Plan for a broader perspective, key levels, and market expectations for the week ahead.

Contextual Analysis & Plan
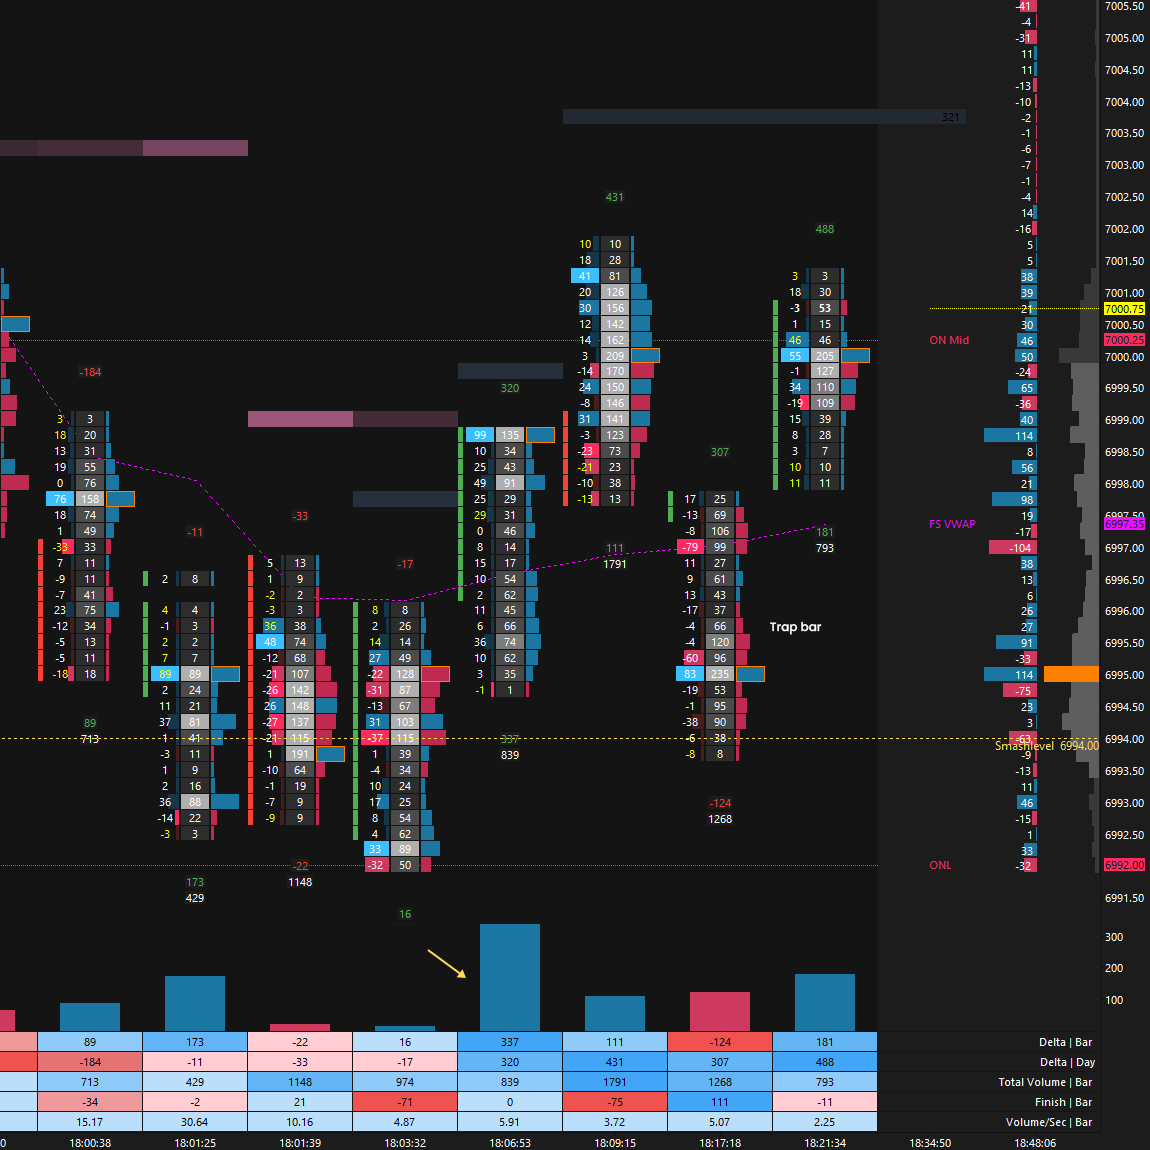
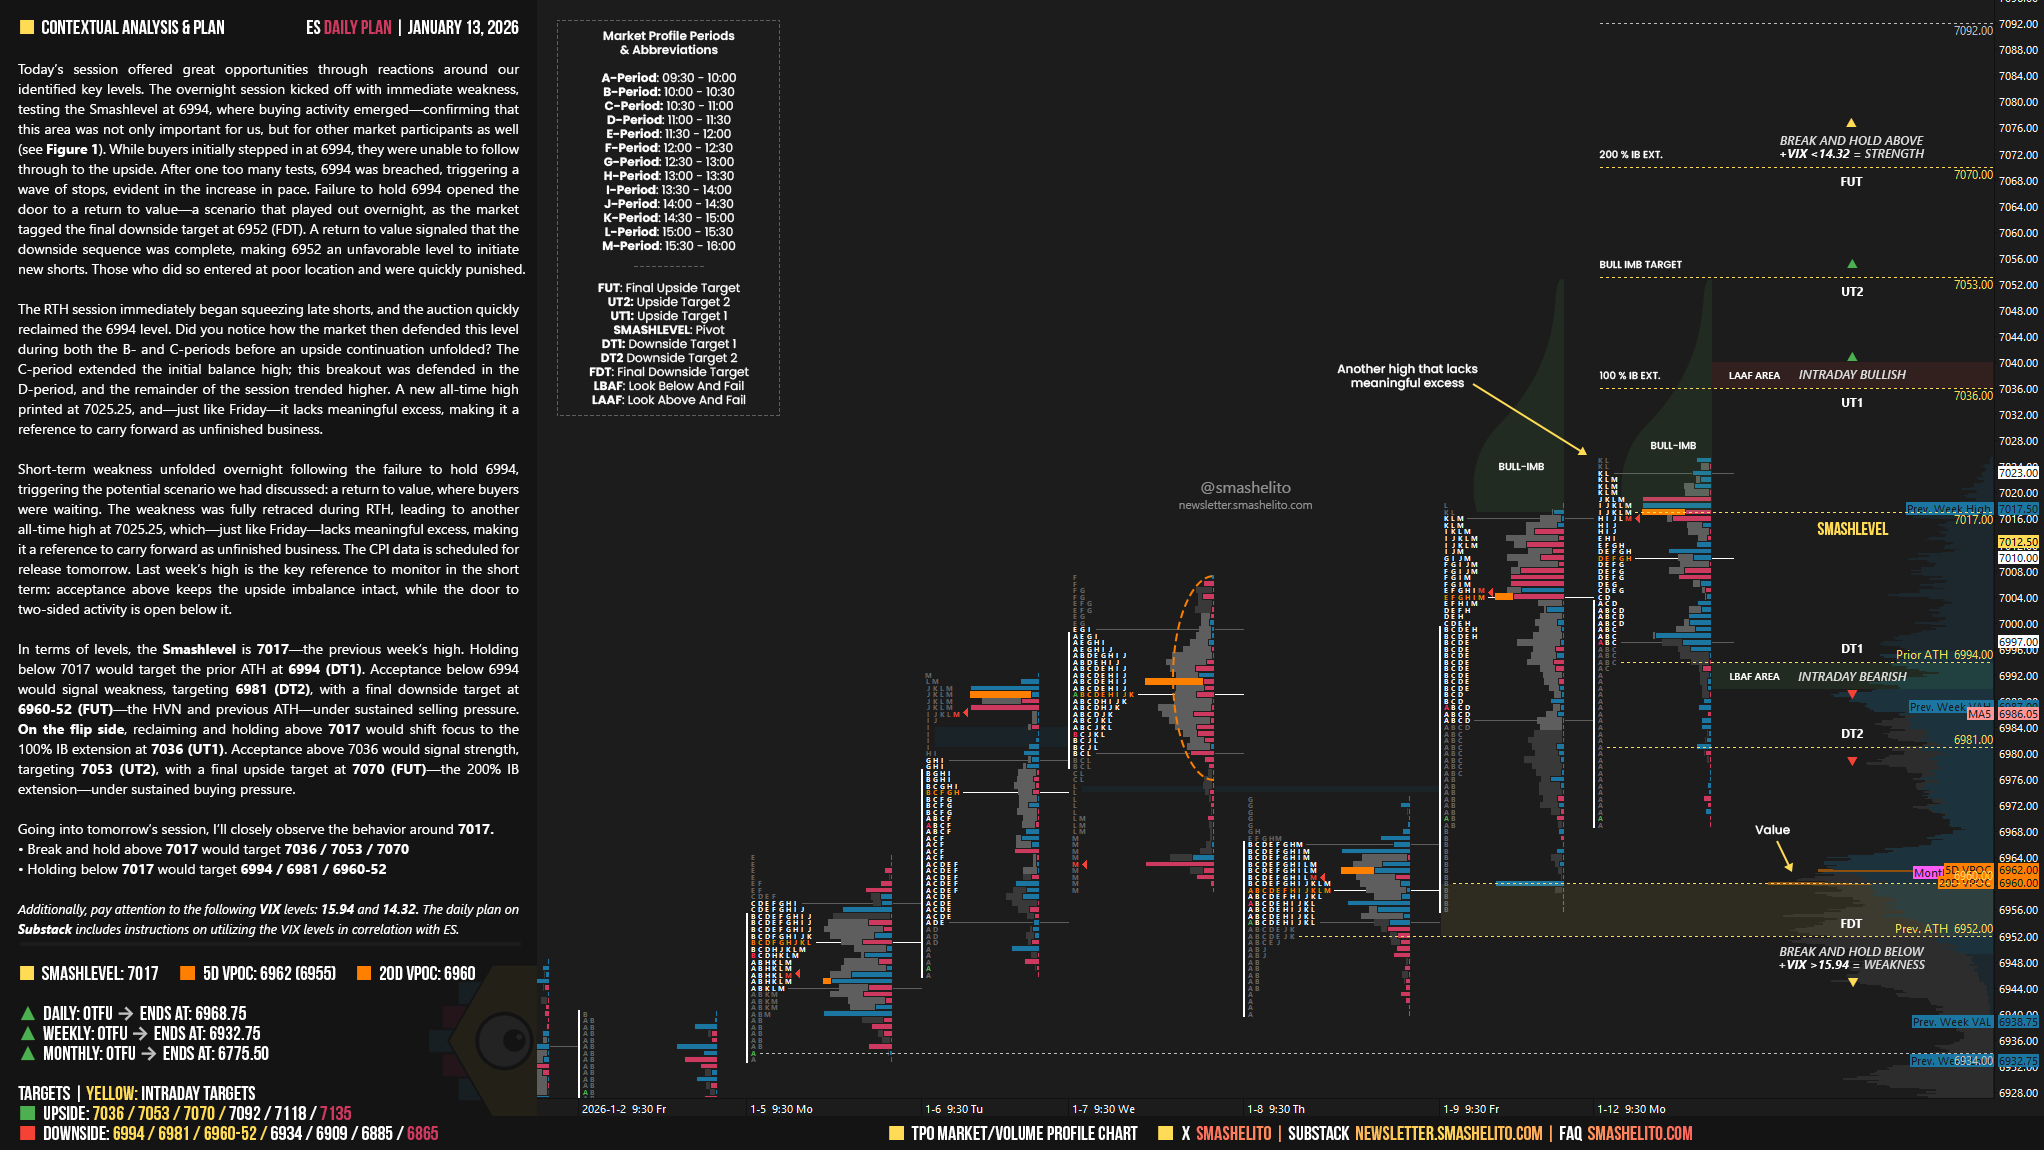
Today’s session offered great opportunities through reactions around our identified key levels. The overnight session kicked off with immediate weakness, testing the Smashlevel at 6994, where buying activity emerged—confirming that this area was not only important for us, but for other market participants as well (see Figure 1). While buyers initially stepped in at 6994, they were unable to follow through to the upside. After one too many tests, 6994 was breached, triggering a wave of stops, evident in the increase in pace. Failure to hold 6994 opened the door to a return to value—a scenario that played out overnight, as the market tagged the final downside target at 6952 (FDT). A return to value signaled that the downside sequence was complete, making 6952 an unfavorable level to initiate new shorts. Those who did so entered at poor location and were quickly punished.
The RTH session immediately began squeezing late shorts, and the auction quickly reclaimed the 6994 level. Did you notice how the market then defended this level during both the B- and C-periods before an upside continuation unfolded? The C-period extended the initial balance high; this breakout was defended in the D-period, and the remainder of the session trended higher. A new all-time high printed at 7025.25, and—just like Friday—it lacks meaningful excess, making it a reference to carry forward as unfinished business.
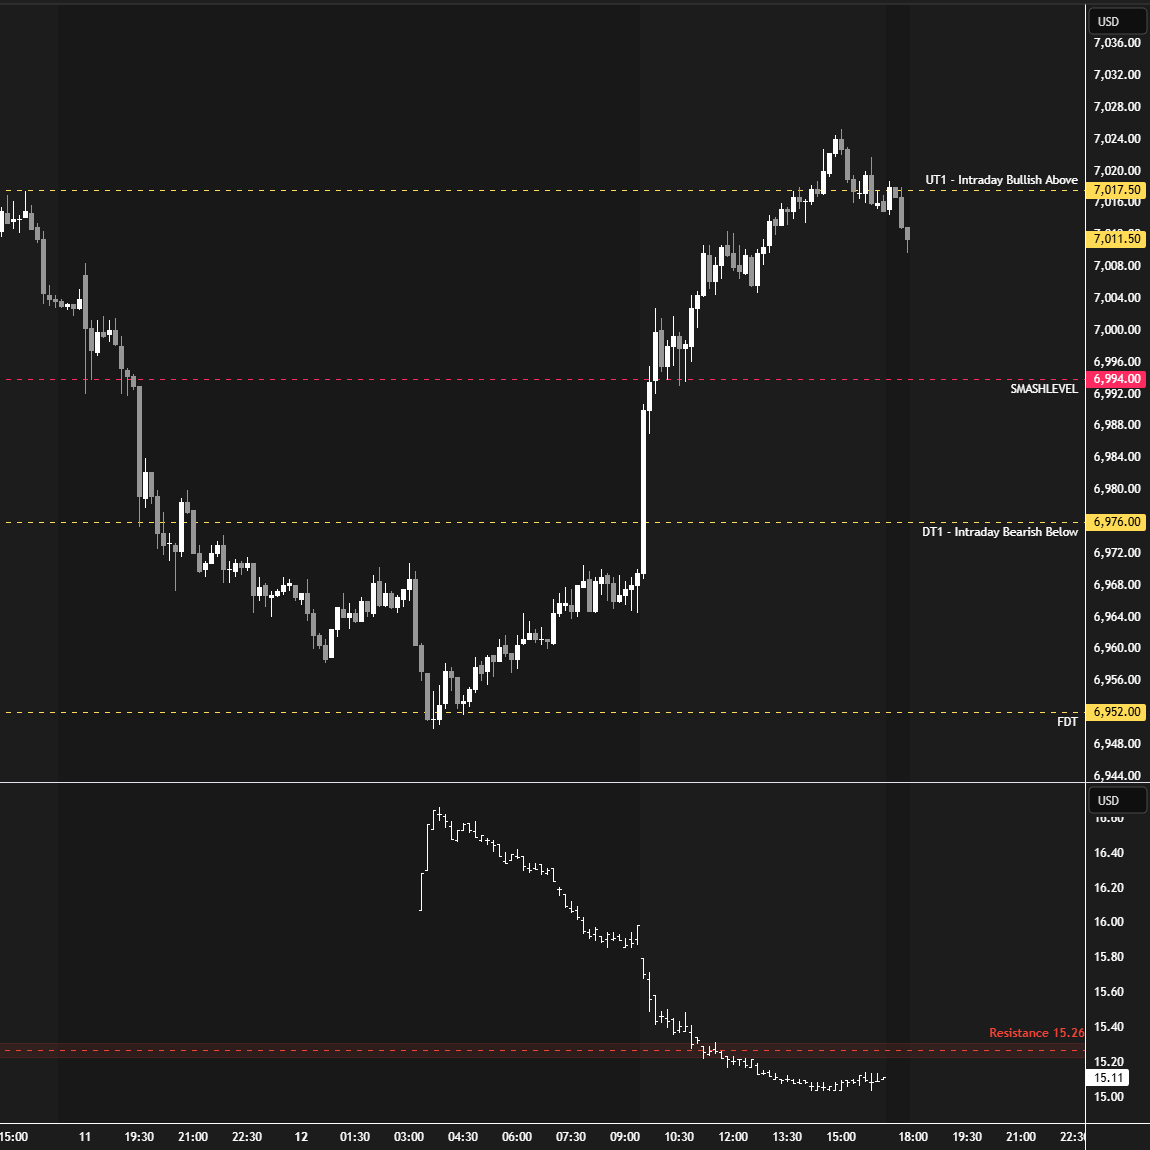
Short-term weakness unfolded overnight following the failure to hold 6994, triggering the potential scenario we had discussed: a return to value, where buyers were waiting. The weakness was fully retraced during RTH, leading to another all-time high at 7025.25, which—just like Friday—lacks meaningful excess, making it a reference to carry forward as unfinished business. The CPI data is scheduled for release tomorrow. Last week’s high is the key reference to monitor in the short term: acceptance above keeps the upside imbalance intact, while the door to two-sided activity is open below it.
In terms of levels, the Smashlevel is 7017—the previous week’s high. Holding below 7017 would target the prior ATH at 6994 (DT1). Acceptance below 6994 would signal weakness, targeting 6981 (DT2), with a final downside target at 6960-52 (FUT)—the HVN and previous ATH—under sustained selling pressure.
On the flip side, reclaiming and holding above 7017 would shift focus to the 100% IB extension at 7036 (UT1). Acceptance above 7036 would signal strength, targeting 7053 (UT2), with a final upside target at 7070 (FUT)—the 200% IB extension—under sustained buying pressure.
Levels of Interest
Going into tomorrow’s session, I’ll closely observe the behavior around 7017.
Break and hold above 7017 would target 7036 / 7053 / 7070
Holding below 7017 would target 6994 / 6981 / 6960-52
Additionally, pay attention to the following VIX levels: 15.94 and 14.32. These levels can provide confirmation of strength or weakness.
Break and hold above 7070 with VIX below 14.32 would confirm strength.
Break and hold below 6960-52 with VIX above 15.94 would confirm weakness.
Overall, it's important to exercise caution when trading outside of the highlighted yellow levels. A non-cooperative VIX may suggest possible reversals i.e trade setups.
Hi Smash, do you ever execute your positions outside of the prep level? On mgl (vwap, mid, ib...) or is your execution is always related to the level and orderflow. thanks for the daily analysis.
Hey Smash. When it comes to your levels are you pretty much ignoring if the overnight profile hits them? Do you even look at the overnight profile or a different chart for overnight?